Usage Monitoring
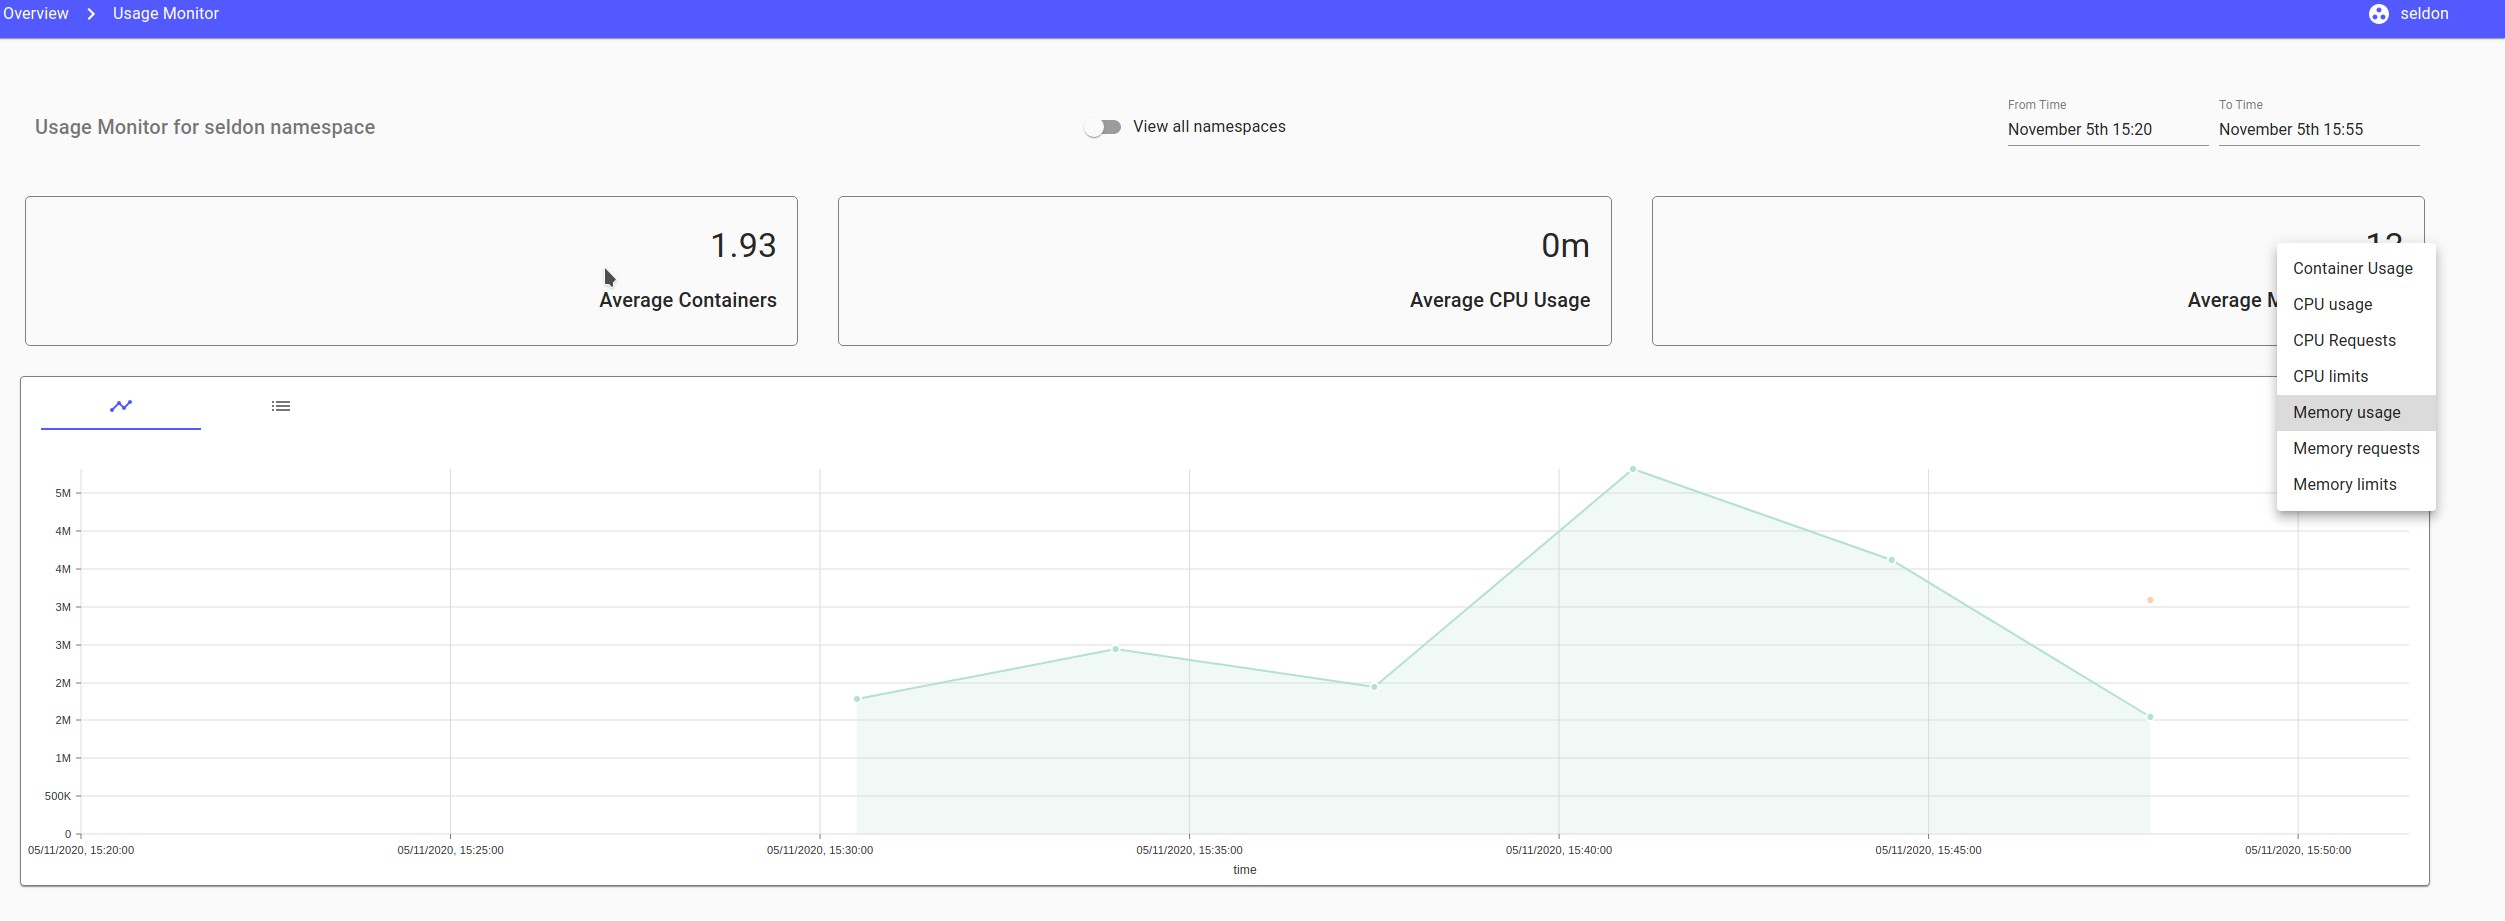
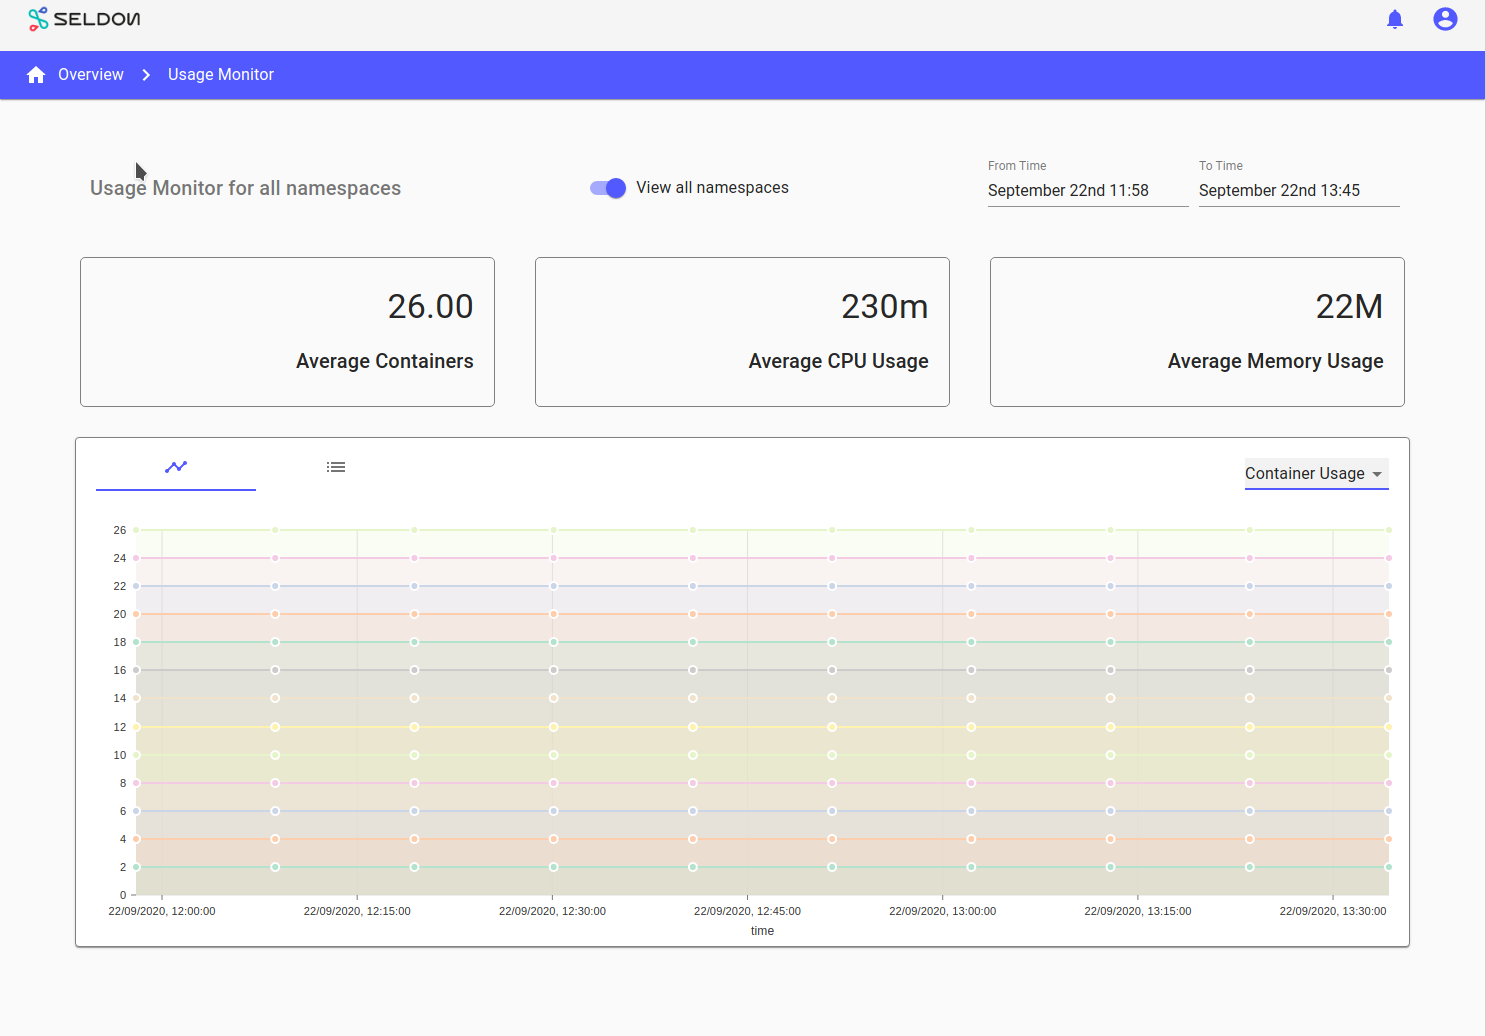
Summary metrics are available showing usage over time. These can be accessed from ‘Usage’ on the top-right menu.
These metrics differ from those shown for individual models on their pages. The summary metrics show multiple models for a namespace or cluster.
By default if the cluster-level is chosen then all models are counted for all namespaces. If you wish to restrict to namespaces visible to the user, set the FILTER_USAGE_MON_NAMESPACES environment variable to true.
Resources are shown broken down by model. The type of resource of interest can be chosen. The containers resource is shown with a comparison against what your license allows for.

Models are stacked on top of each other in the breakdown when there are multiple
