 Seldon Enterprise Platform Documentation Update
Help and Support
Identify and debug issues within the Seldon ecosystem
If the information in this guide does not help you to resolve your issue, you can contact the Seldon team via your customer representative. If you do so, please provide as much detail as you can about your particular installation of Seldon Enterprise Platform.
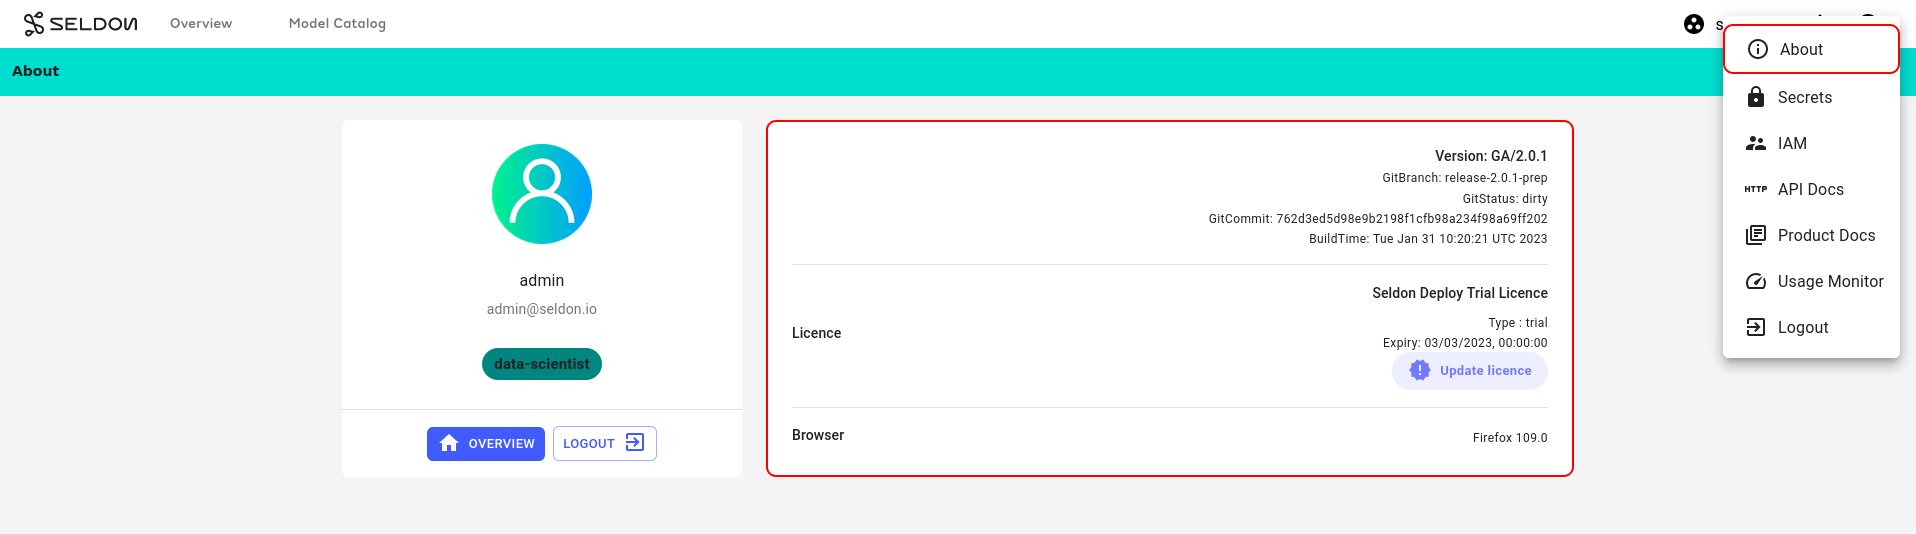
The About page, which can be accessed via the menu in the top-right corner of the UI, displays the Seldon Enterprise Platform version details, license details, and your browser version. For more details on your specific browser, please visit https://www.whatsmybrowser.org/ and share the URL that can provide us with more information about your browser usage, like resolution and other support needed.
Browser Requirements
Seldon Enterprise Platform supports all modern browsers, including Chrome, Firefox, Safari, and Microsoft Edge. We recommend using the latest browser version available to your operating system. See your browser’s documentation to learn more about checking and updating your version.
Please pay attention to the following recommendations for using the Seldon Enterprise Platform UI effectively:
Cookies - cookies must be enabled in your browser, per our Cookie Policy. Blocking cookies will interfere with your interactions with the Enterprise Platform UI.
JavaScript - JavaScript must be enabled to interact with the Enterprise Platform UI. Avoid programs that block JavaScript, like anti-virus software, or add exceptions for Seldon Enterprise Platform.
Browser add-ons or extensions - browser add-ons might interfere with your use of the Enterprise Platform UI. While disabling them isn’t always required, we may ask you to disable them when helping you troubleshoot.
Browser window sizes - your computer’s screen size determines the maximum browser window resolution. For the best experience, use a browser window at least 1280 pixels wide and 768 pixels tall.
Errors from Seldon Enterprise Platform
It is often the case that errors in Seldon Enterprise Platform are caused by faults or misconfigurations in other parts of the system. However, it is still useful to check Enterprise Platform’s understanding of the problem, as it may offer insights into what is happening.
If you experience Seldon Enterprise Platform crashing or returning an error, the best first steps are to:
Turn on the network tab in your browser’s Developer Tools (via right-click and ‘Inspect’ in chrome), ensure the session is being recorded, and recreate the issue. Find the failed call(s) and inspect the full message(s).
Find the Seldon Enterprise Platform pod (usually in the
seldon-systemnamespace) and inspect its logs. You can filter for messages at levelwarnorerror.
This should help to determine if the cause is within Seldon Enterprise Platform or another component. If the issue is with Enterprise Platform itself, please report the bug directly to Seldon. Likewise, if the issue appears to be with Seldon Core, please either report the bug or raise an issue on GitHub. Otherwise, please check the below sections or refer to the documentation and information available online for that component. If you still cannot resolve the issue, it can be reported to Seldon.
Auth
See the auth section for debugging tips.
Knative
See the Knative install section for how to verify Knative.
Argo and Batch
See the Argo section for debugging batch and the MinIO section for MinIO.
Prometheus
See the metrics section for debugging Prometheus.
Serving Engines
For Seldon Core debugging, it is best to see their respective docs.
In our demos we load models from google storage buckets. In the model logs we sometimes see this:
Compute Engine Metadata server unavailable onattempt
This is a known Google Storage issue but does not cause failures. Treat this as a warning.
Request Logs Entries Missing
Sometimes requests fail to appear in the request logs. Often this is a problem with the request logger setup. If so see the request logging docs.
Sometimes we see this error in the request logger logs:
RequestError(400, 'illegal_argument_exception', 'mapper [request.instance] cannot be changed from type [long] to [float]')
What happens here is Elasticsearch has inferred the type of the fields in the request for the model’s index. This is inferred on the first request and if it changes or is inferred incorrectly this has to be addressed manually.
The best thing to do here is to delete the index.
First port-forward Elasticsearch. If, for example, Open Distro Elasticsearch is used then this is:
kubectl port-forward -n seldon-logs svc/opensearch-cluster-master 9200
To delete the index we need to know its name. The pattern is:
inference-log-<seldon/kfserving>-<namespace>-<modelname>-<endpoint>-<modelid>
Usually endpoint is default unless there’s a canary, and modelid is usually <modelname>-container if created via the Seldon Enterprise Platform UI.
You may use the Elasticsearch API to list the available indices in Elasticsearch with:
curl -k --request GET 'https://localhost:9200/_cat/indices/inference-log-*'
which should return something like:
yellow open inference-log-seldon-seldon-income-default-income-container                       xWEBE-xXQA65cEIitp6SHw 1 1 9646    0   3.4mb   3.4mb
yellow open inference-log-seldon-seldon-income-classifier-default-income-classifier-container wUeX7fiISpSIGFCoHI05Cg 1 1   61   60 151.1kb 151.1kb
yellow open inference-log-seldon-seldon-batch-demo-default-batch-demo-container               3oYtAwL1Q-2Gi3og91iGdg 1 1 1848 1093   1.3mb   1.3mb
Then delete the index with a curl command.
If the auth is admin/admin and there’s a cifar10 seldon model in a namespace also called seldon then it’s:
curl -k -v -XDELETE https://admin:admin@localhost:9200/inference-log-seldon-seldon-cifar10-default
Hint
Optionally, for easier debugging, you may also install Kibana or its equivalent OpenSearch Dashboards to visualize and inspect indices in Elasticsearch.
You may wish to expose these via ingress routing rules, such as Istio VirtualServices or standard Kubernetes Ingress resources.
Insufficient ephemeral storage in EKS clusters
When using eksctl, the volume size for each node will be of 20Gb by default.
However, with large images this may not be enough.
This is discussed at length on this thread in the eksctl repository.
When this happens, pods usually start to get evicted.
If you run kubectl describe on any of these pods, you should be able to see errors about not enough ephemeral storage.
You should also be able to see some DiskPressure events on the output of kubectl describe nodes.
To fix it, it should be enough to increase the available space.
With eksctl, you can do so by tweaking the nodeGroups config and adding a volumeSize and volumeType keys.
For instance, to change the volume to 100Gb you could do the following in your ClusterConfig spec:
apiVersion: eksctl.io/v1alpha5
kind: ClusterConfig

...

nodeGroups:
  - volumeSize: 100
    volumeType: gp2
    ...
Elastic Queue Capacity
If request logging is used with a high throughput then it’s possible to hit a rejected execution of processing error in the logger.
This comes with a queue capacity message.
To address this the thread_pool.write.queue_size needs to be increased.
For example, with the Elasticsearch Helm chart this could be:
esConfig:
  elasticsearch.yml: |
    thread_pool.write.queue_size: 2000