 Seldon Enterprise Platform Documentation Update
Health Check
Seldon Enterprise Platform has a built-in health check that aims to monitor the availability of its surrounding ecosystem as well as troubleshoot problems when they arise. This can be done as an intermediary step before checking the logs or contacting us.
Where to find the Health Check Monitor
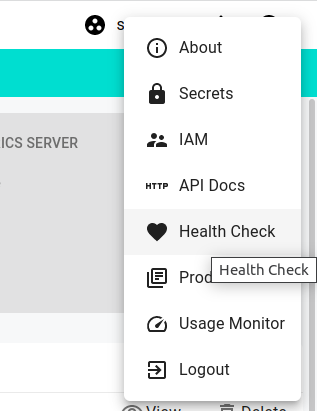
You can find the health check by clicking on the user icon on the top right of the screen.

Then you can select Health Check.
Afterwards, you should see a page like this:
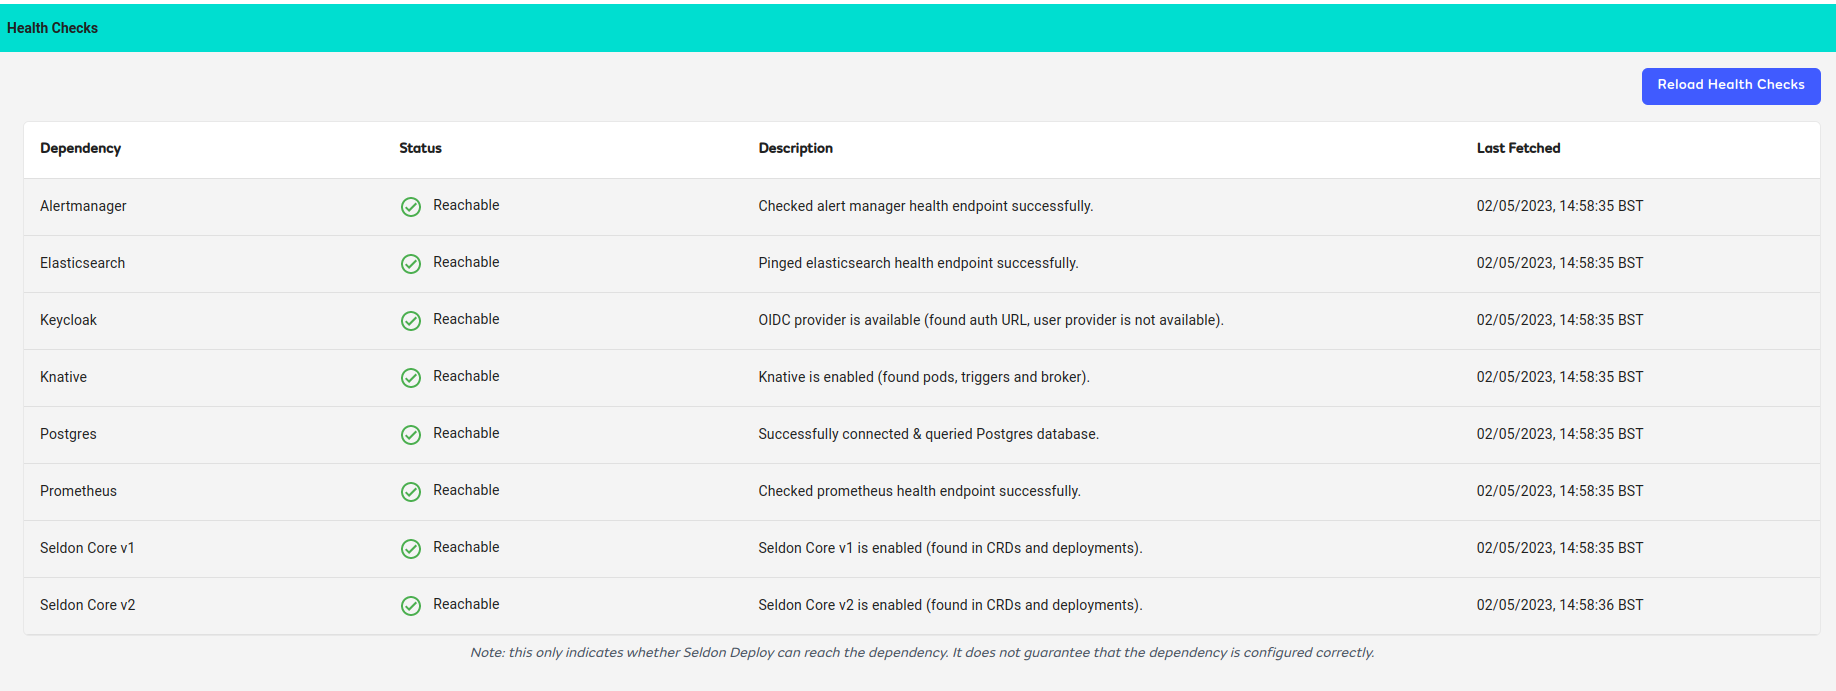
Health Check Components Explained
Note: The health check is still experimental; if you have any issues, please contact us.
Dependency |
What does the check do? |
|---|---|
|
- pings Alertmanager’s internal health endpoint |
|
- pings Elasticsearch’s internal health endpoint |
|
- checks if OIDC provider is available |
|
- checks if Knative Eventing CRDs |
|
- checks first if Postgres is enabled |
|
- pings Prometheus’ internal health endpoint |
|
- checks if Seldon Core v1 CRDs are installed |
|
- checks if Seldon Core v2 CRDs are installed |