Seldon Enterprise Platform Documentation Update
Seldon Pipeline Canary Promotion
Iris Model

Iris is the genus of flower which contains 3 species: setosa, versicolor, and virginica. This demo is based on iris classification model based on flower properties like sepal length, sepal width, petal length, and petal width. The species are also the classes that will be used for the classification. Here we will:
Deploy a pretrained sklearn iris model
Load test the model
Observe requests and metrics
Deploy a canary XGBoost model
Load test canary model
Observe requests and metrics for both models
Promote the canary model
Launch a Seldon Pipeline
From the
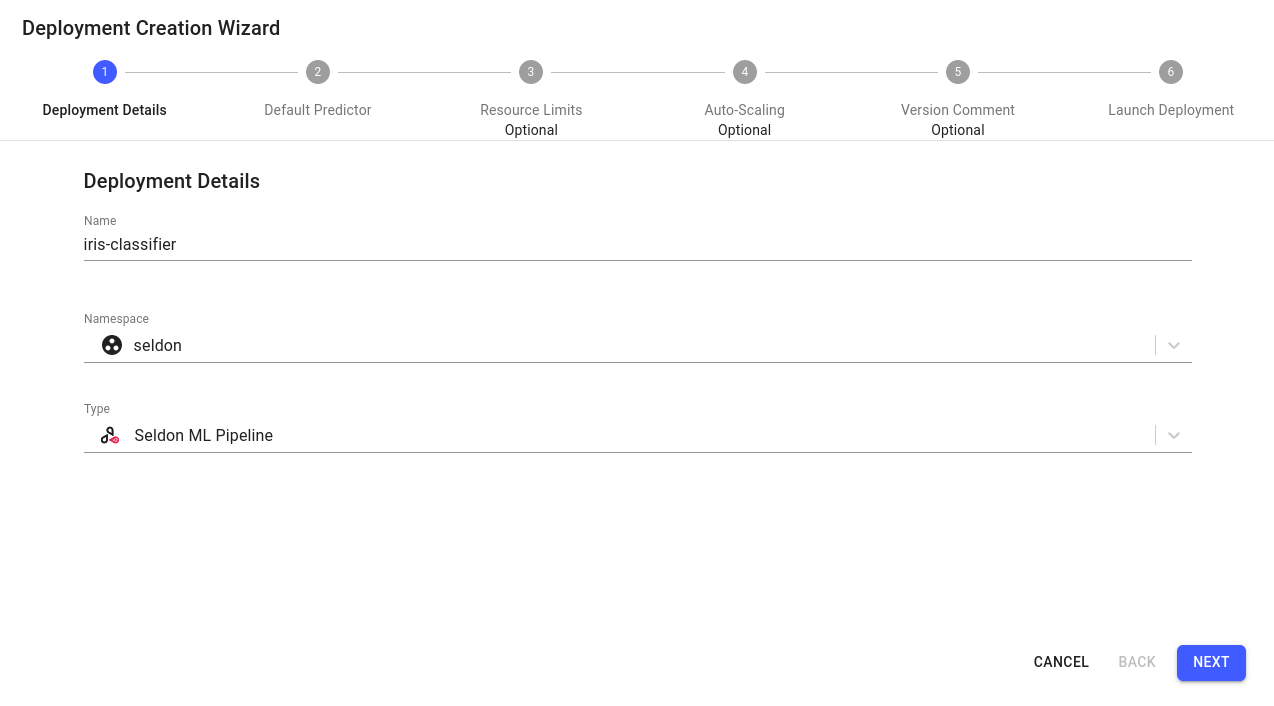
Overviewpage, select theCreate new deploymentbutton in the top right cornerIn the
Deployment Creation Wizard, enter the deployment details as follows:Name: iris-classifier
Namespace: seldon
Type: Seldon ML Pipeline
Expand to see deployment
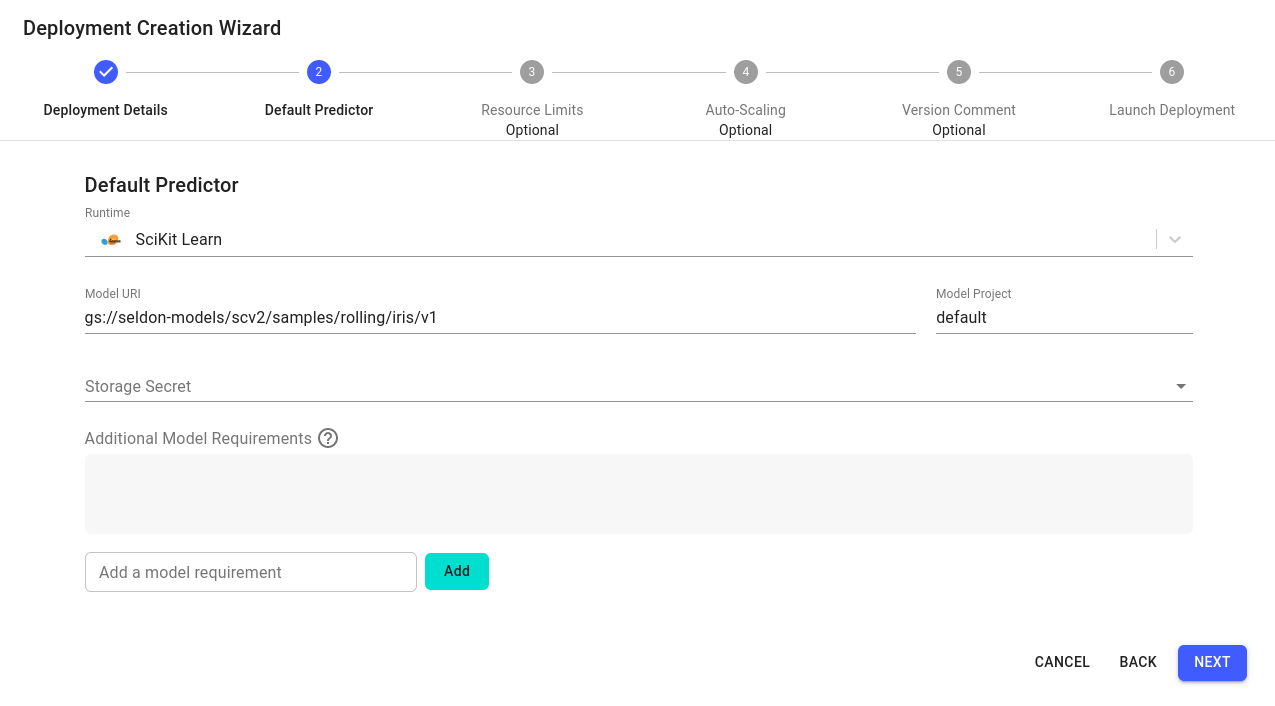
Configure the default predictor as follows:
Runtime: Scikit Learn
Model URI:
gs://seldon-models/scv2/samples/rolling/iris/v1Model Project: default
Storage Secret: (leave blank/none)
Expand to see default predictor
Skip
Nextfor the remaining steps, then clickLaunch.If your deployment is launched successfully, it will have an
Availablestatus in theOverviewpage.
Start Load Test
Once the deployment is in an
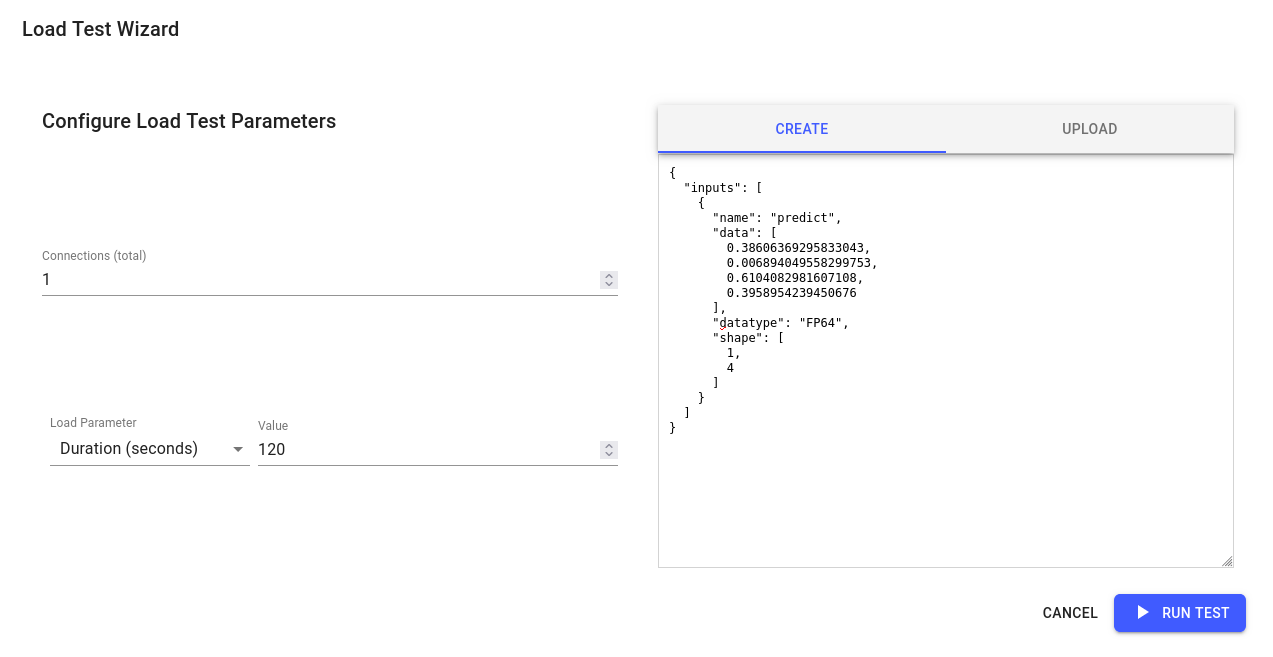
Availablestatus, navigate to itsDashboardpage by clicking on it.In the
Requests Monitorsection, click on theStart a load testbutton to start a load test with the following details:Connections(total): 1
Load Parameter: Duration(seconds)
Value: 120
Json payload:
{
    "inputs": [
        {
            "name": "predict",
            "data": [
                0.38606369295833043,
                0.006894049558299753,
                0.6104082981607108,
                0.3958954239450676
            ],
            "datatype": "FP64",
            "shape": [
                1,
                4
            ]
        }
    ]
}
Expand to see load test
This will spawn a Kubernetes Job that will send continuous prediction requests for the specified seconds to the SKLearn model in the deployment.
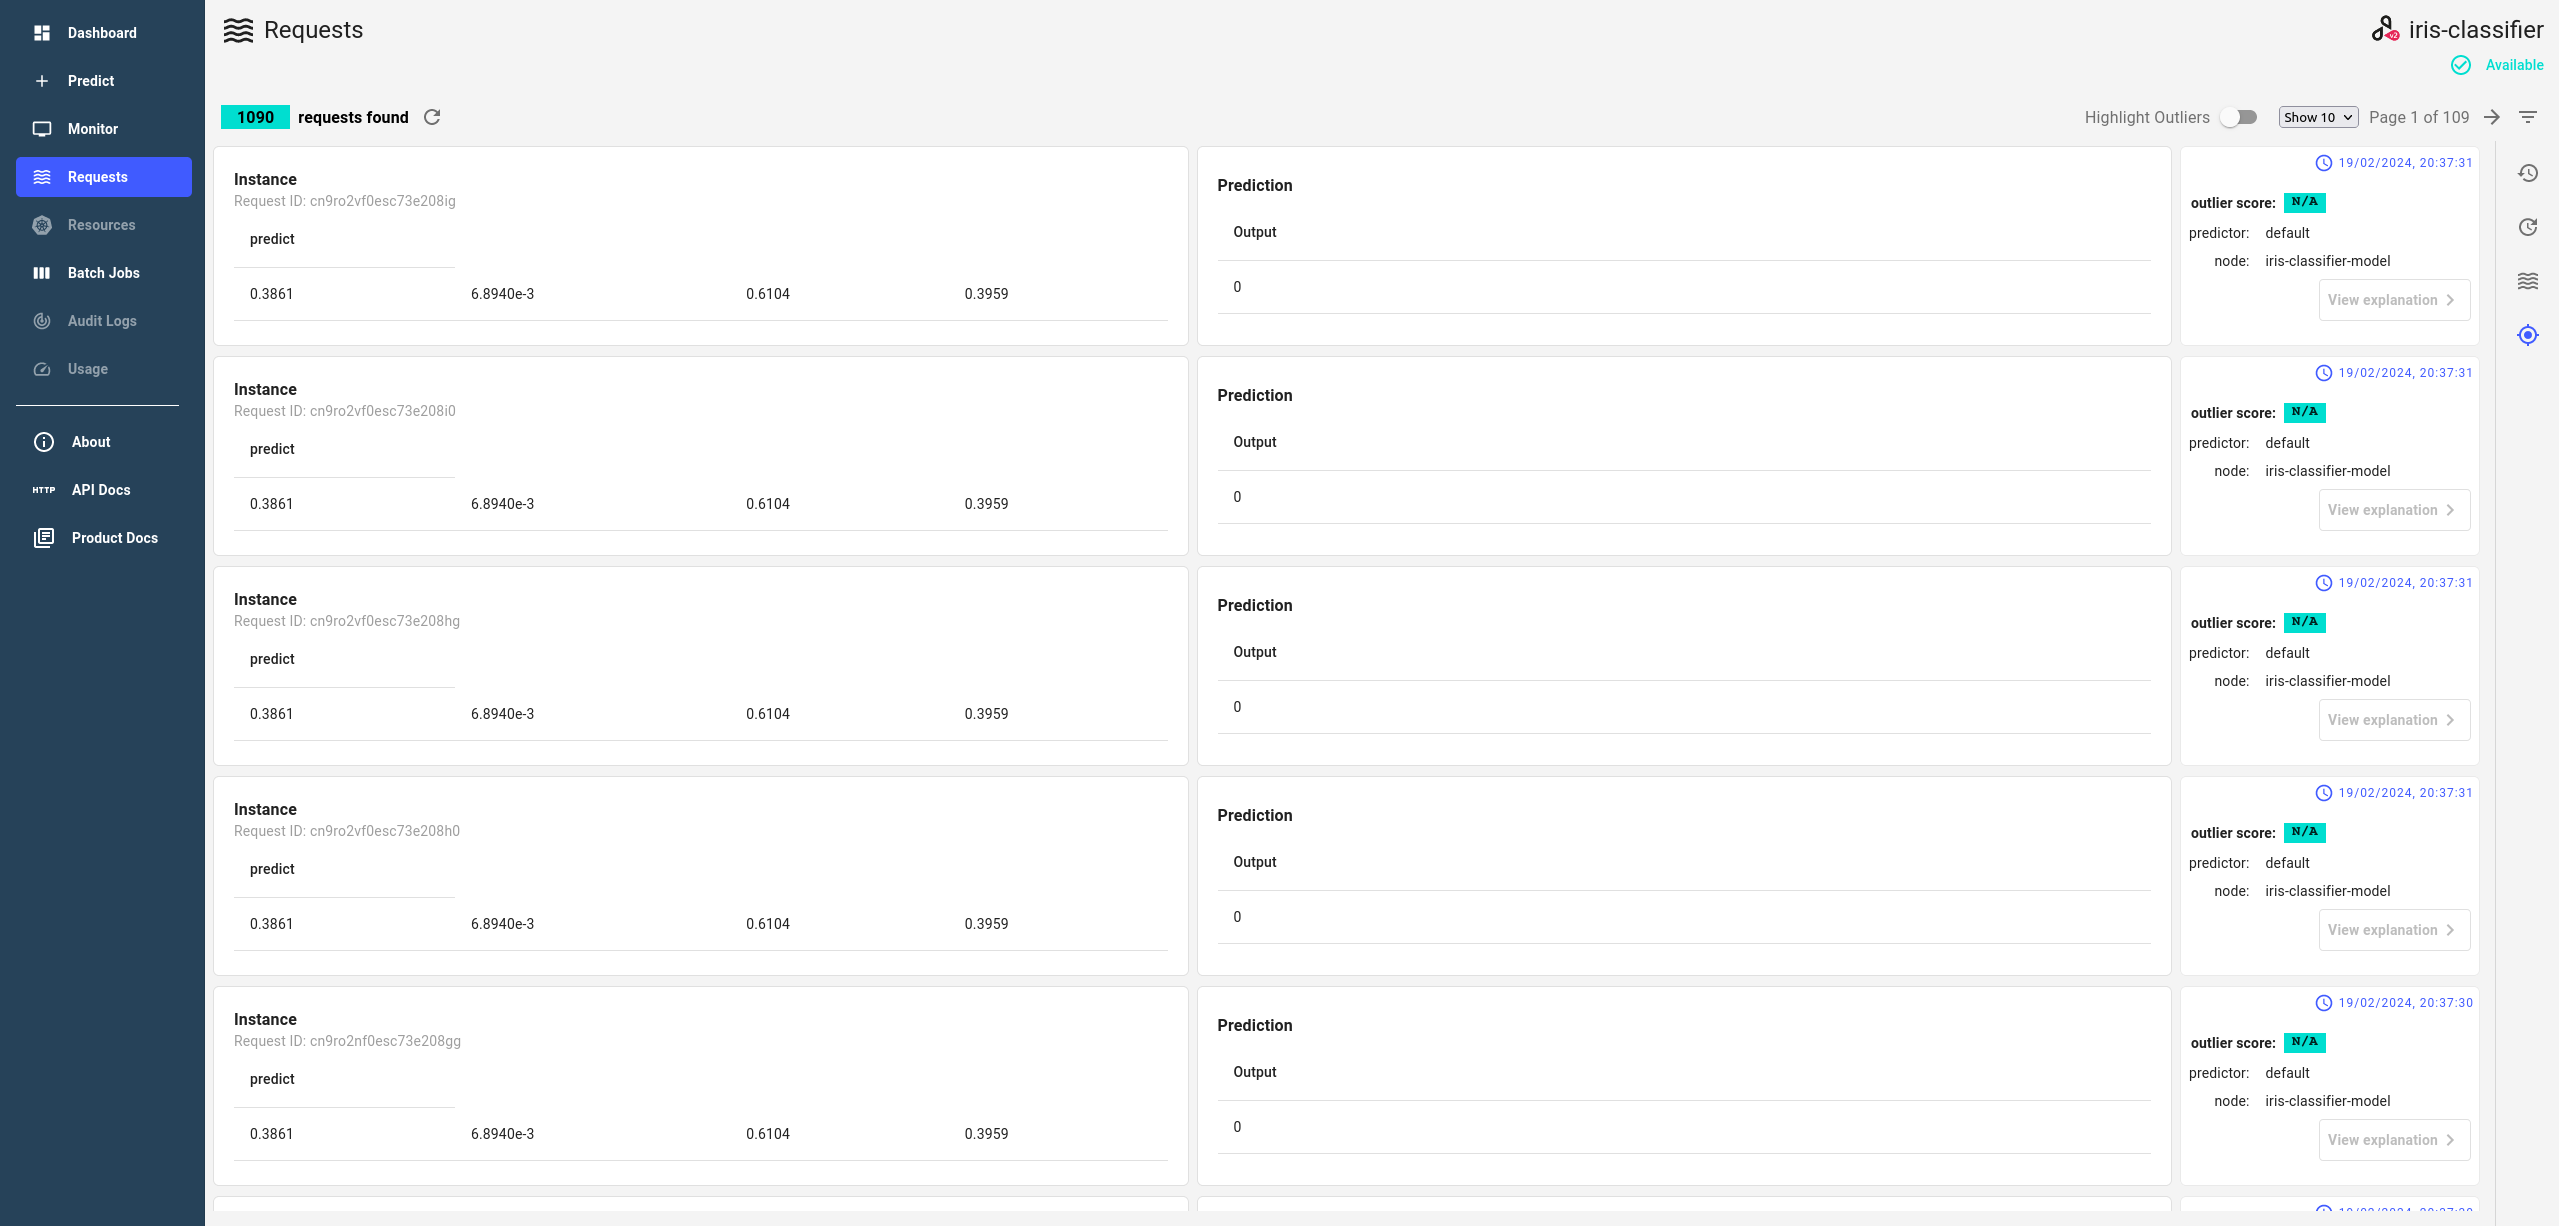
Observe requests and metrics
Once the load test has started, you can monitor the upcoming requests, their responses and metrics in the Requests page the deployment.
If this doesn’t work, consult the request logging docs section for debugging.
Expand to see prediction requests and responses
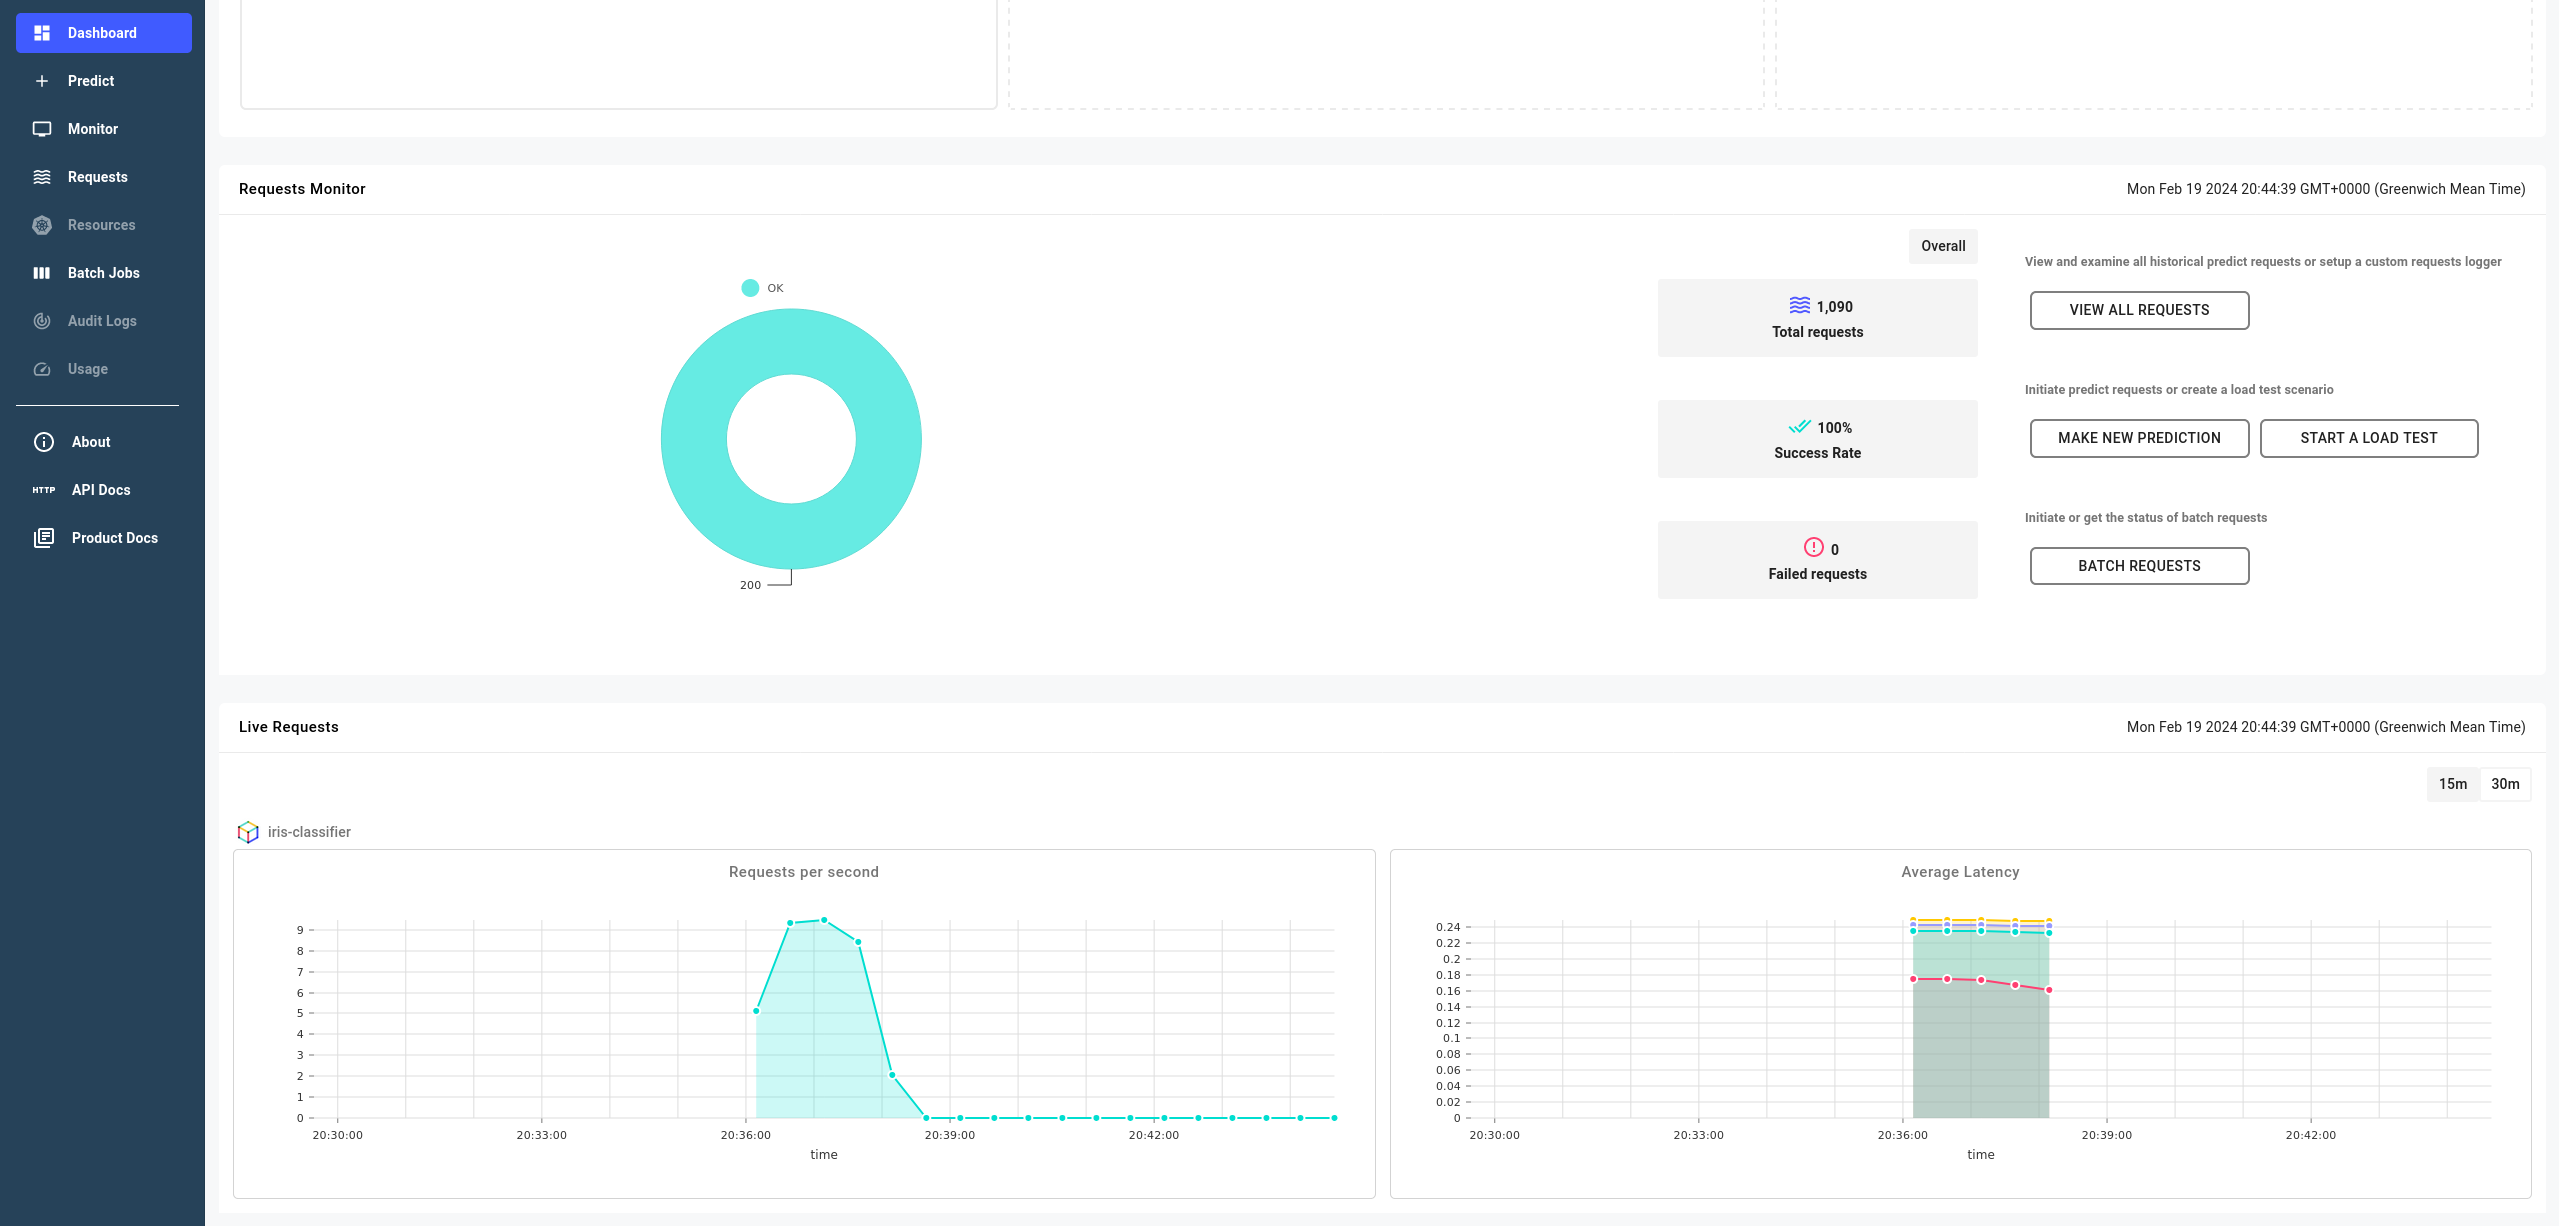
You can also see core metrics in the Dashboard page.
Expand to see prediction requests metrics
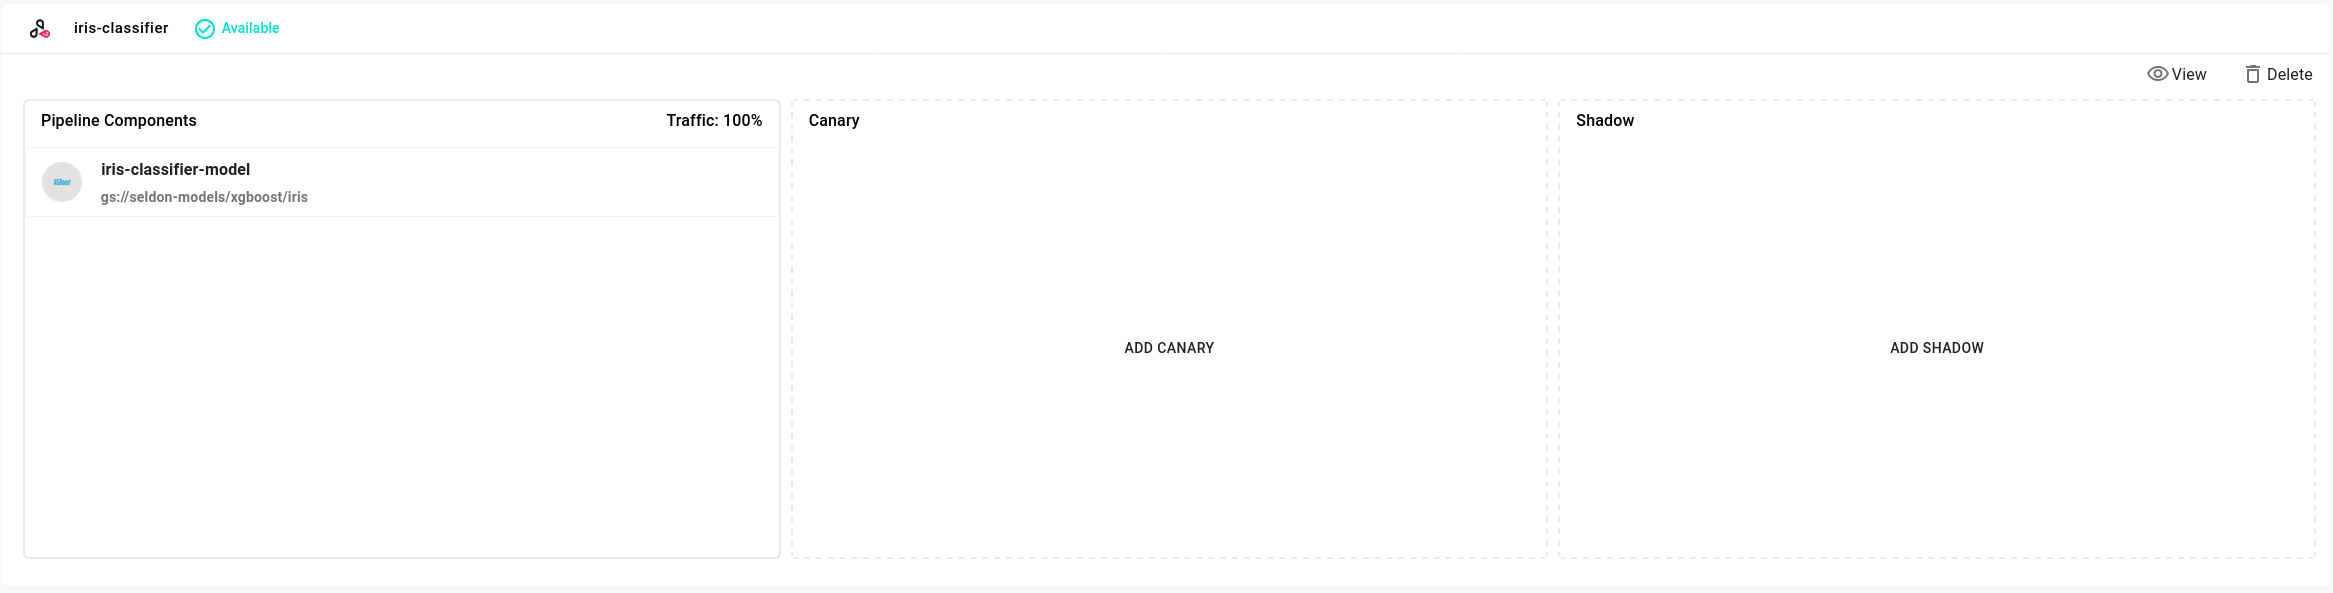
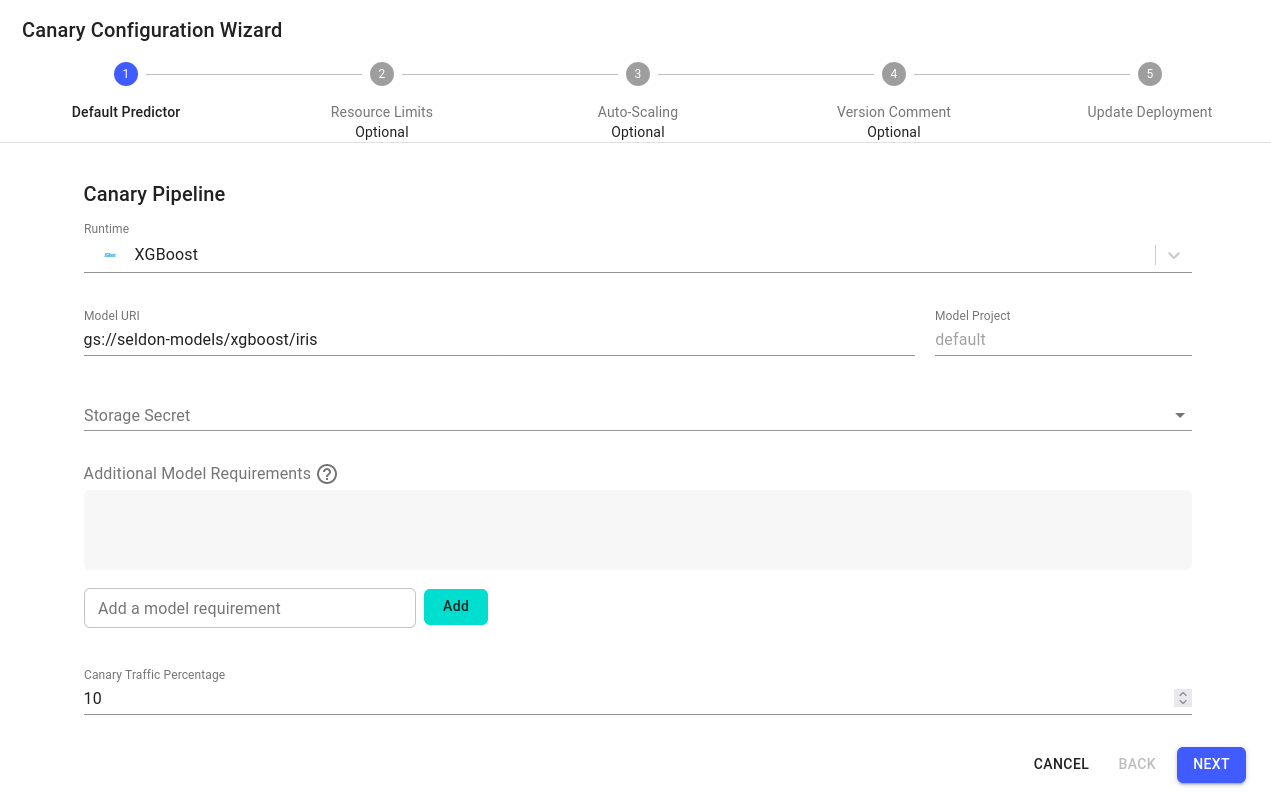
Deploy a Canary model
The next step is to create an XGBoost canary model.
Navigate to the
Dashboardof the deployment and click on theAdd Canarybutton.In the
Canary Configuration Wizard, configure the default predictor as follows:Runtime: XGBoost
Model URI:
gs://seldon-models/xgboost/irisModel Project: default
Storage Secret: (leave blank/none)
Canary Traffic Percentage: 10
Expand to see default predictor
Skip
Nextfor the remaining steps, then clickLaunch.If the canary model is launched successfully, the deployment will remain in an
Availablestatus.
This will create a new canary deployment with the XGBoost model and 10% of the traffic will be sent to it.
Note
The deployment status represents the status of the main model. If the canary model is not successfully launched, there will be a warning icon you can click on to see the error message.
Load test the canary model
This time, we will create a new load test with the canary model running and observe the requests and metrics for both models. You can use either the same Json payload from the previous load test or construct a new one with different values or number of predictions.
Warning
Remember that roughly 10% of the traffic will be sent to the canary model. If, however, the canary model is not available, all the traffic will be sent to the main model.
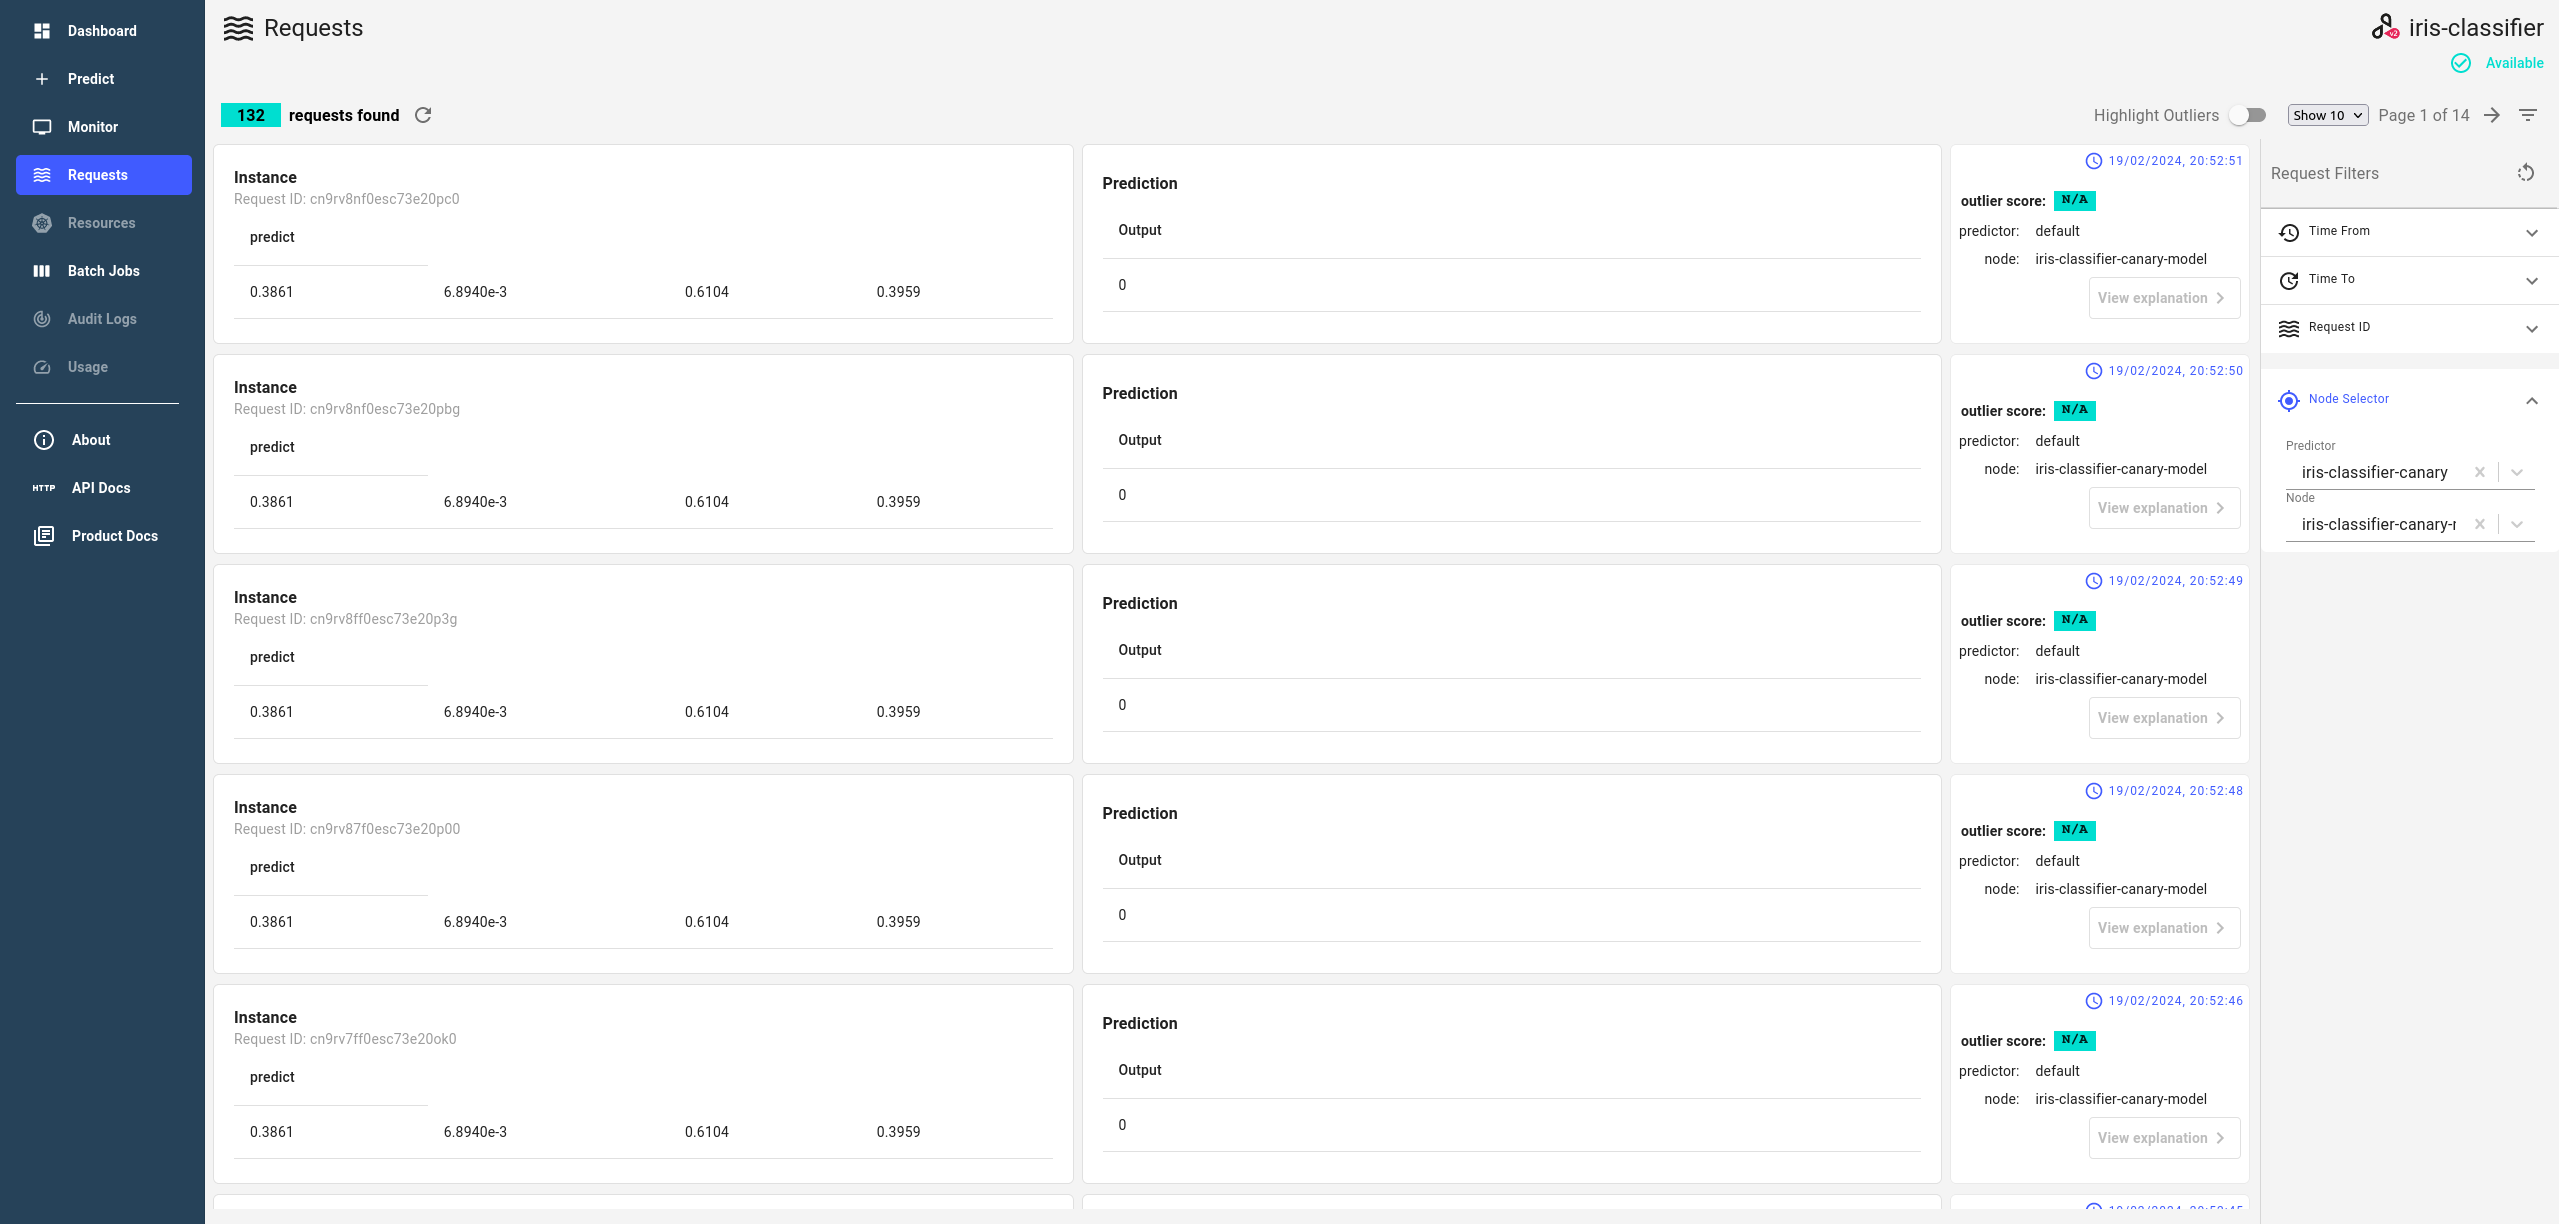
Observe requests and metrics for both models
Once the load test has started, you can monitor the upcoming requests, their responses and metrics in the Requests page the deployment.
If this doesn’t work, consult the request logging docs section for debugging.
In order to see the requests for the canary model, you need to select the iris-classifier-canary predictor and the related Node in the Node Selector filter in the Requests page, as shown on the screenshot.
Take a note that the number of requests for the canary model will be 10% of the total number of requests, as was specified in the canary deployment.
Expand to see prediction requests and responses for the canary model
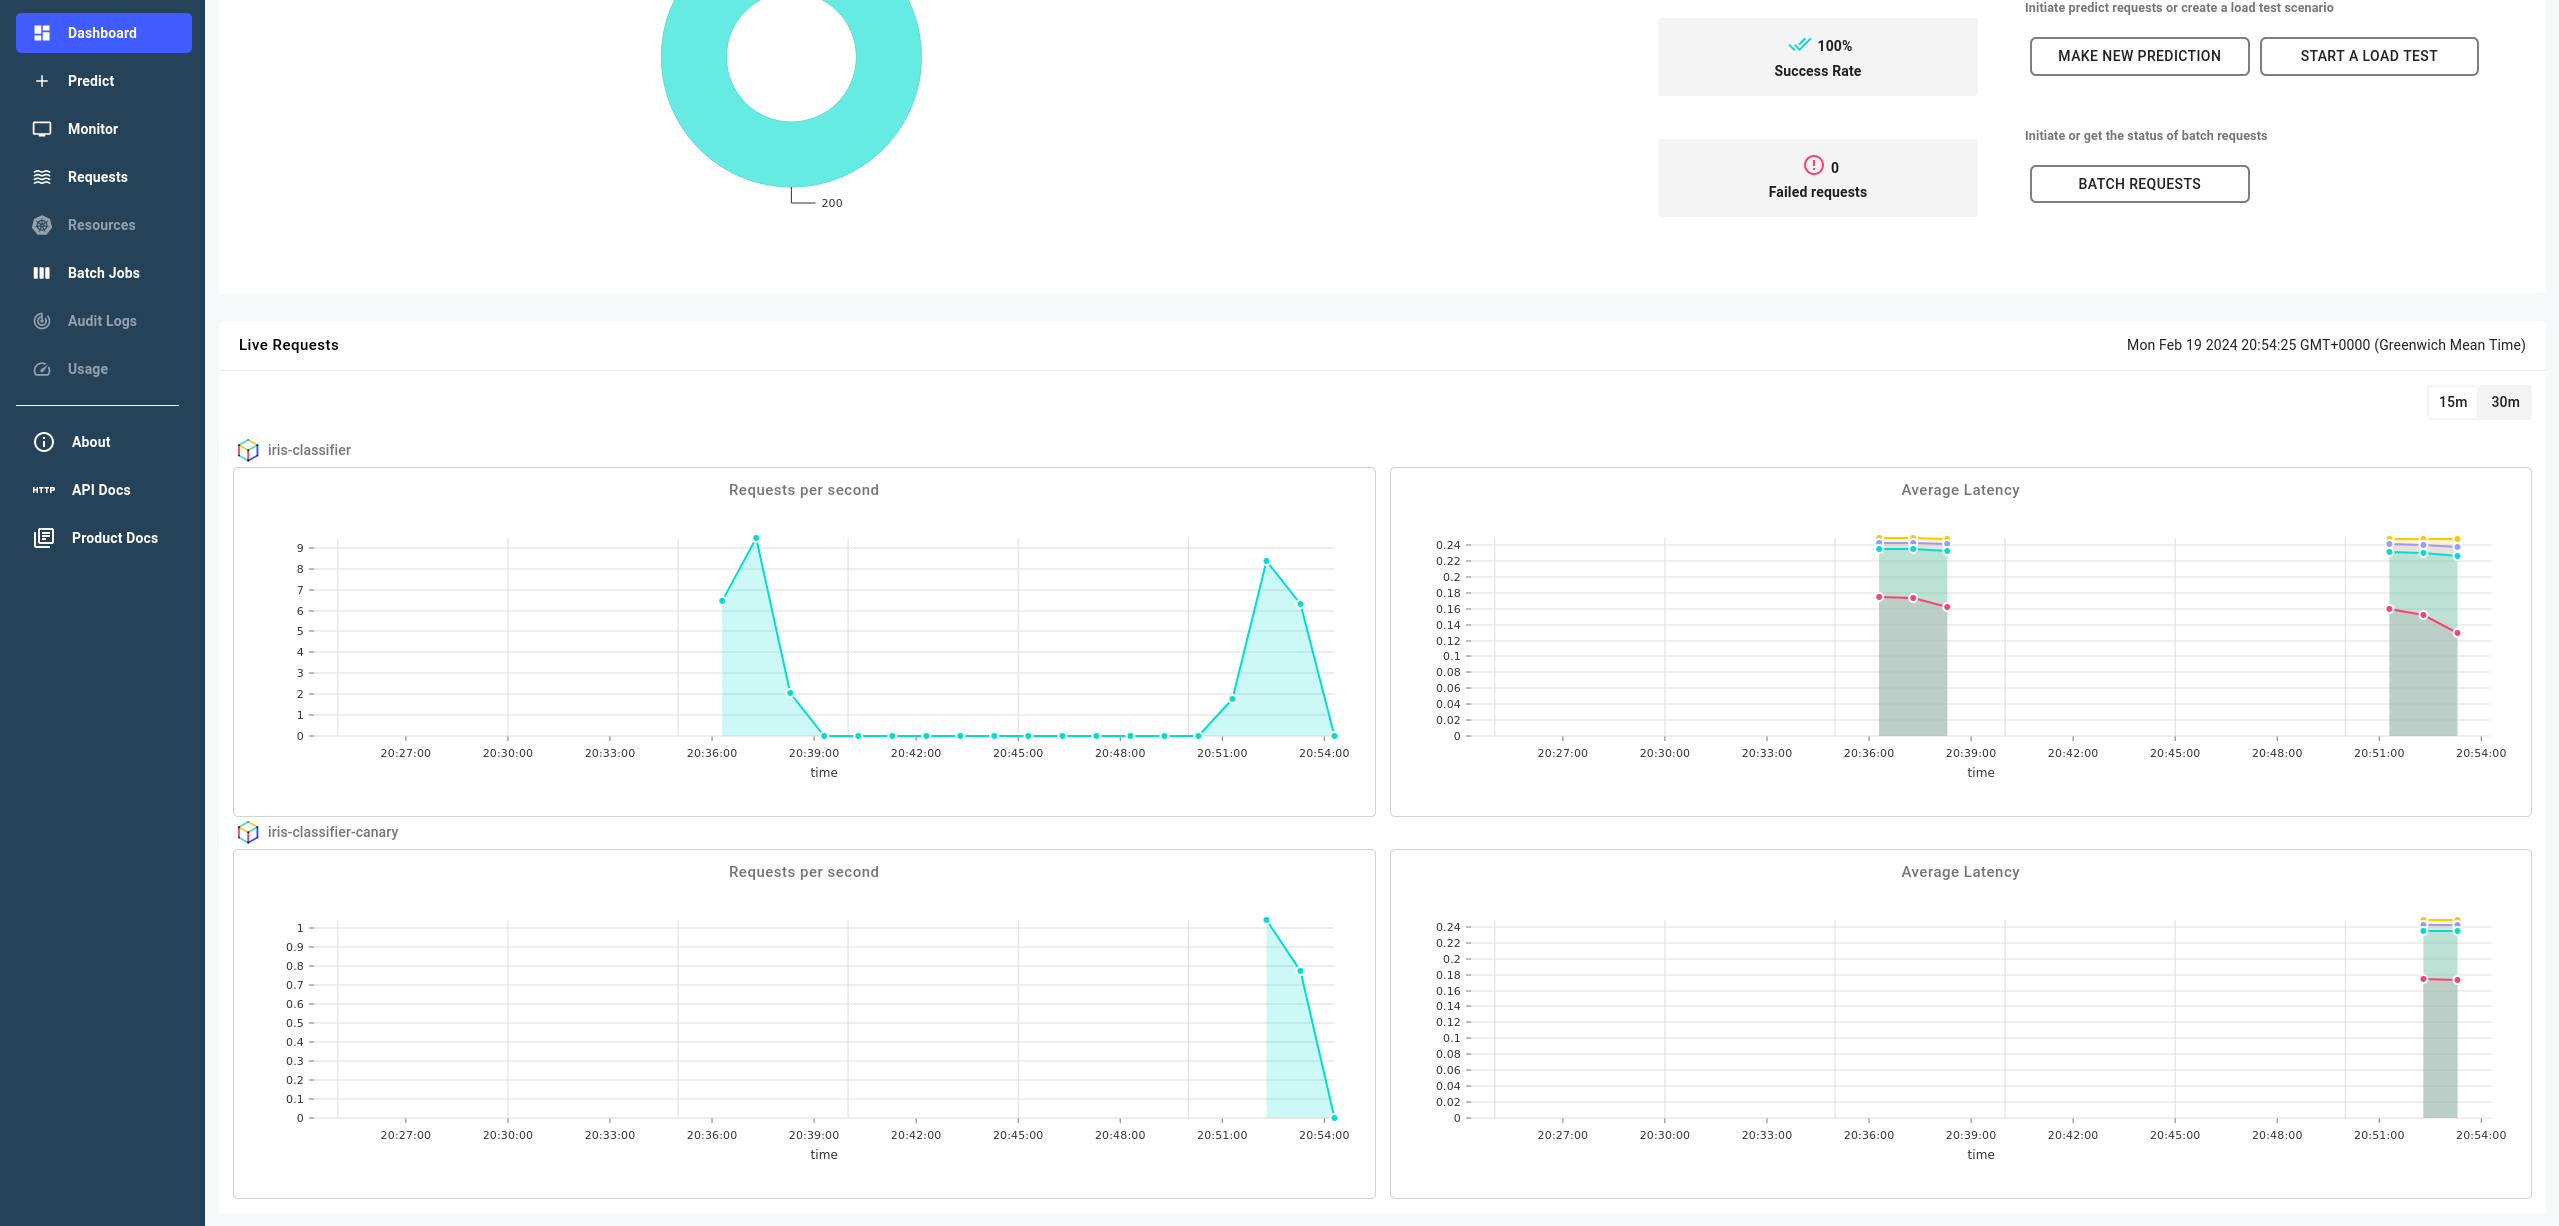
You can also see core metrics for both models in the Dashboard page.
Expand to see prediction requests metrics for both models
Promote the Canary model
Great! Now we have observed the requests and metrics for both models. If we are happy with how the canary model is performing, we can promote it to become the main model.
Navigate to the
Dashboardof the deployment and click on thePromote Canarybutton.In the
Promote Canarydialog, clickConfirmto promote the canary model to the main model.If the canary model is promoted successfully, the deployment will remain in an
Availablestatus.
Expand to see the promoted canary