 Seldon Enterprise Platform Documentation Update
Deployment Dashboard
This guide will walk you through the features available in the Deployment Dashboard. You can navigate to the dashboard for a specific deployment by clicking on it in the main Overview screen.
There is a menu on the left-hand side of the Deployment Dashboard, which allows you to navigate between various parts of the dashboard’s functionality.
Dashboard
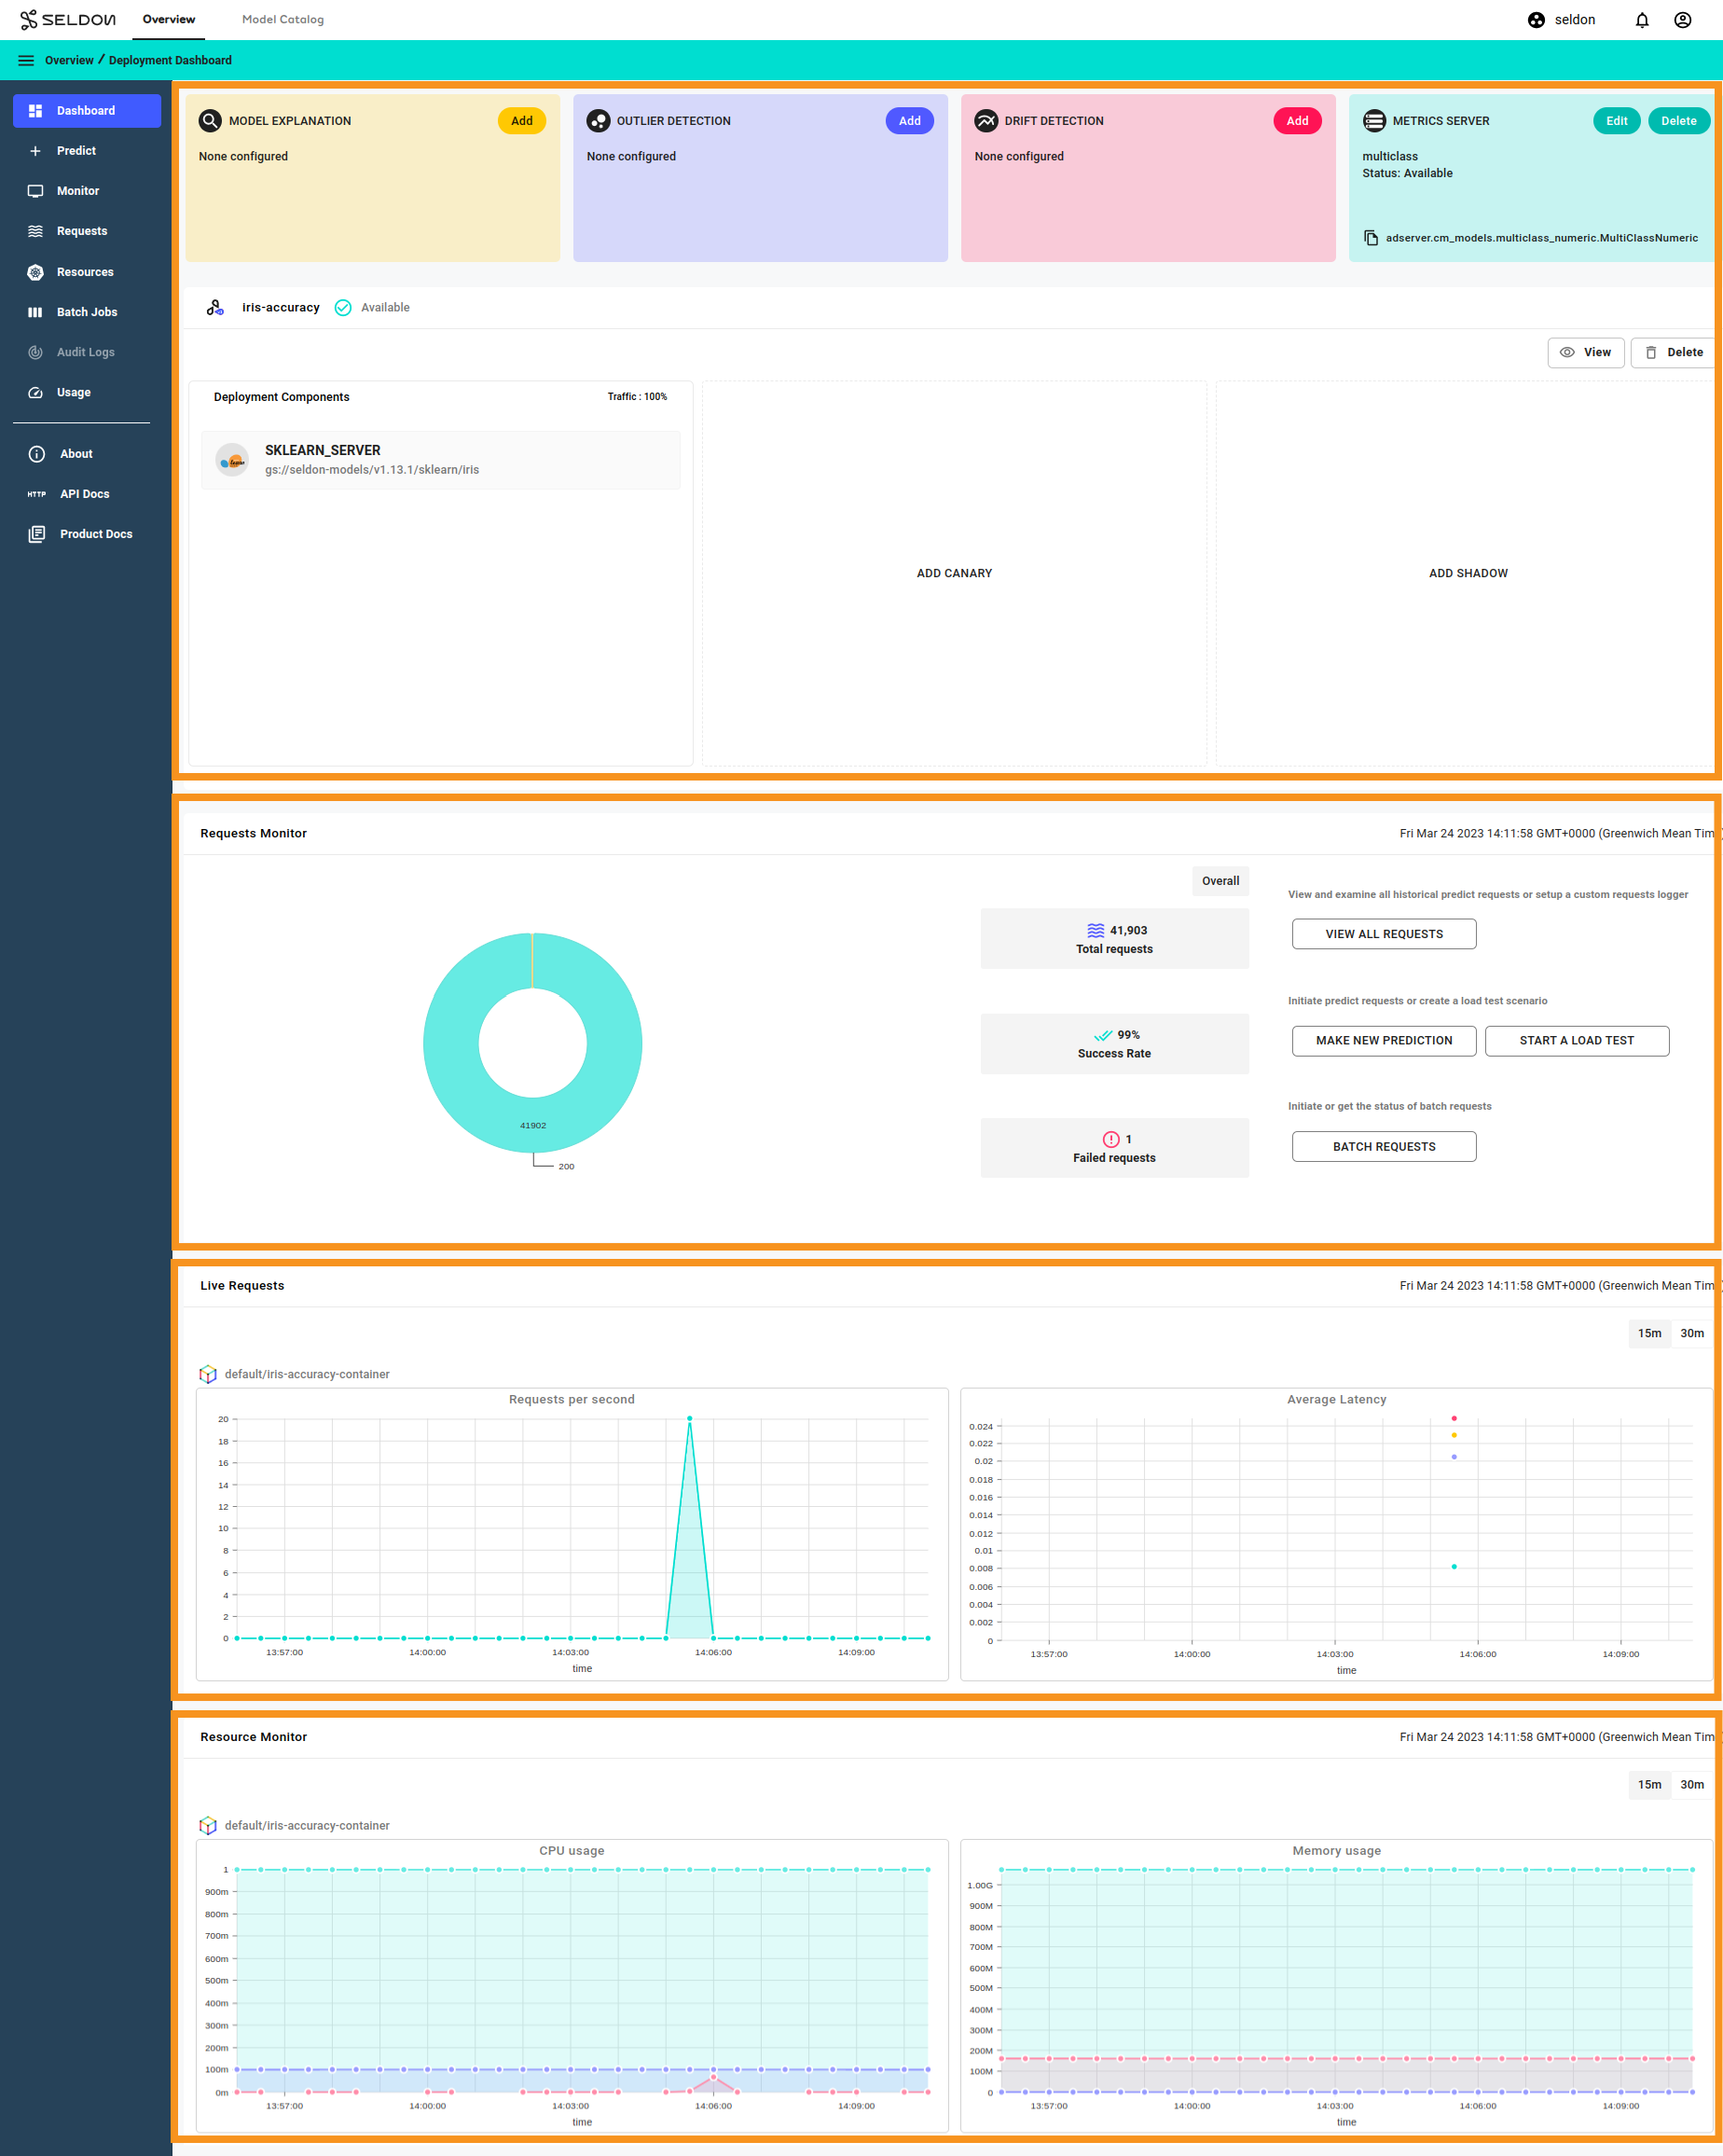
This top-level Dashboard page allows you to inspect and interact with your deployment.
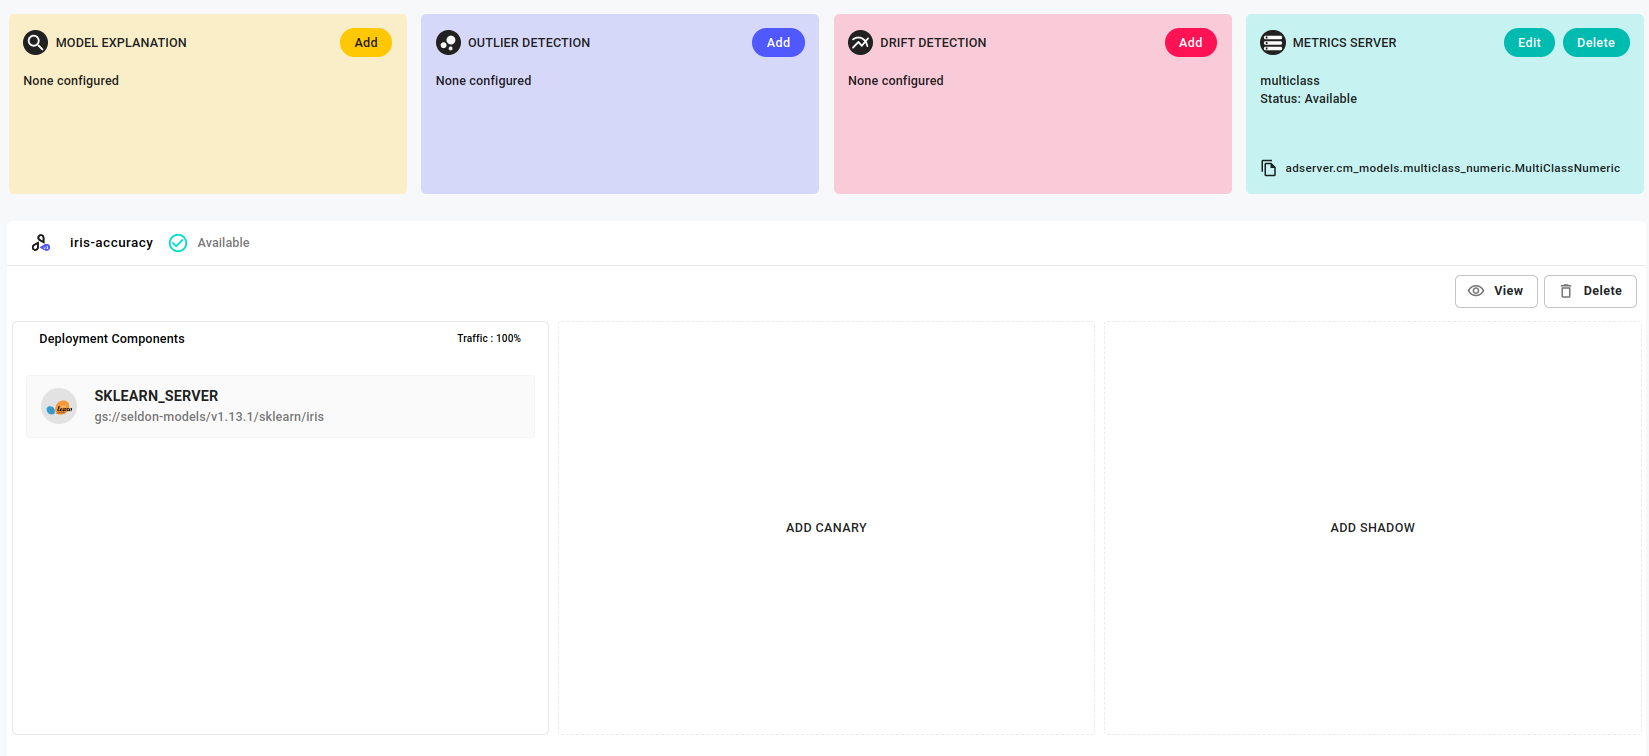
On the top row, you can configure different monitoring and explainability components for your deployment. See Model Explanations and Data Drift Detection for details.
The deployment name and status are shown here, along with a logo indicating the deployment type (i.e. Seldon Deployment or Seldon ML Pipeline).
Clicking on the model name under the Pipeline Components/Deployment Components section will display a model metadata pane to the right.
Clicking on the View button on the right displays the Kubernetes manifest for your deployment, while the Delete button deletes the deployment altogether, including any monitoring and explainability components.
You can also perform actions on Canary and Shadow deployments.
See Rollout Strategies for details.
If a canary deployment is present, traffic is split between this and the default deployment, with traffic percentages displayed on the top right of each deployment pane.
Note
The Metrics Server component is only available for deployments of type Seldon Deployment.
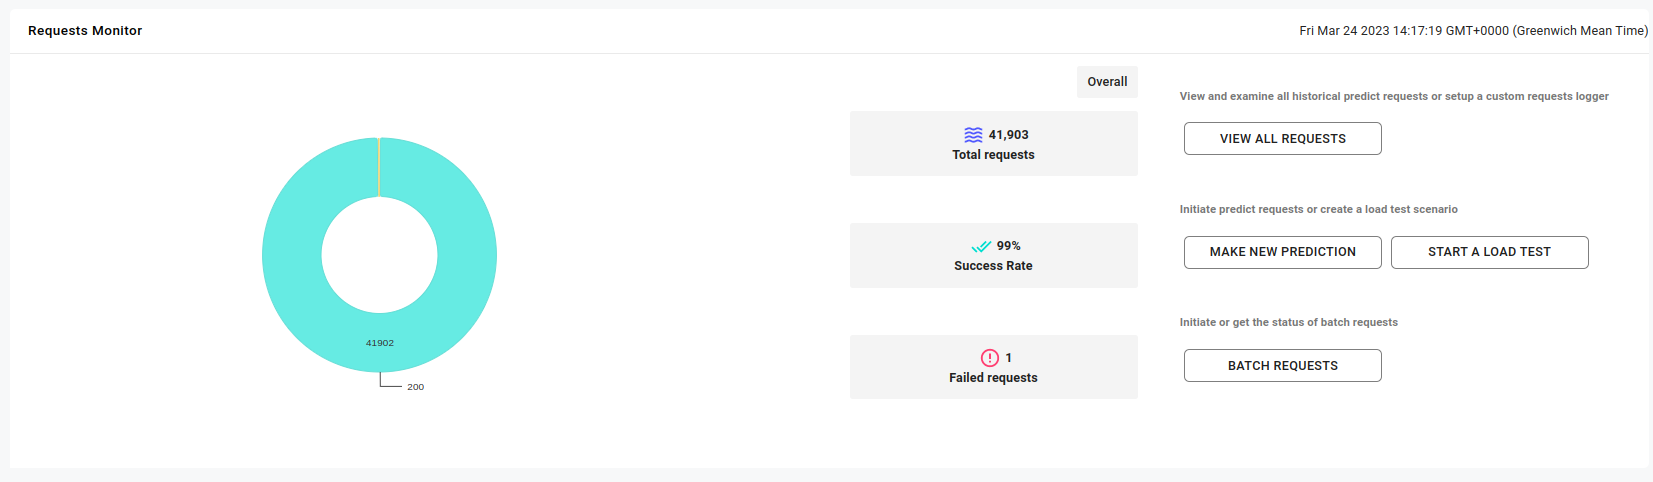
Request Monitoring
The Dashboard view also includes request monitoring panels for real-time request metrics.
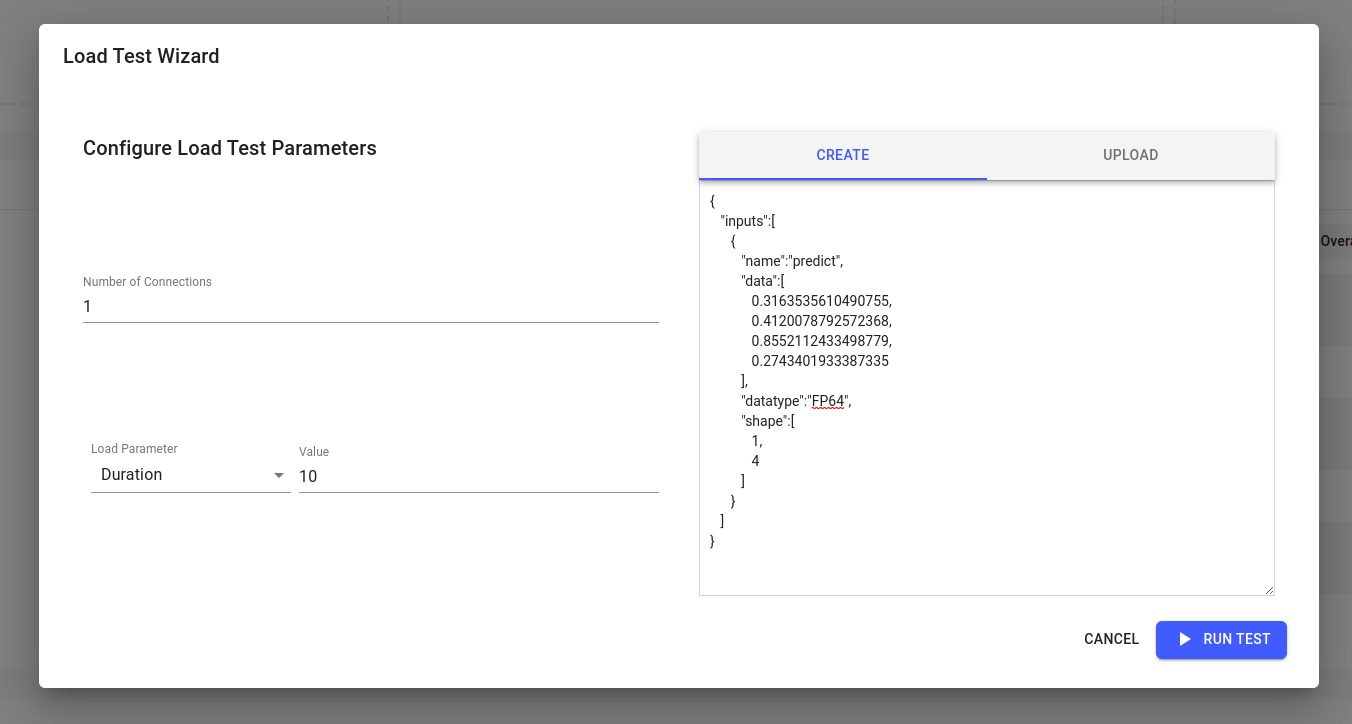
Load Test
Within the Requests Monitor section, you can find the START A LOAD TEST button on the right.
You can set the request JSON data here to start load testing, with the number of requests to send or the duration for which the requests are sent.
Note that it could take a little while to provision the load test.
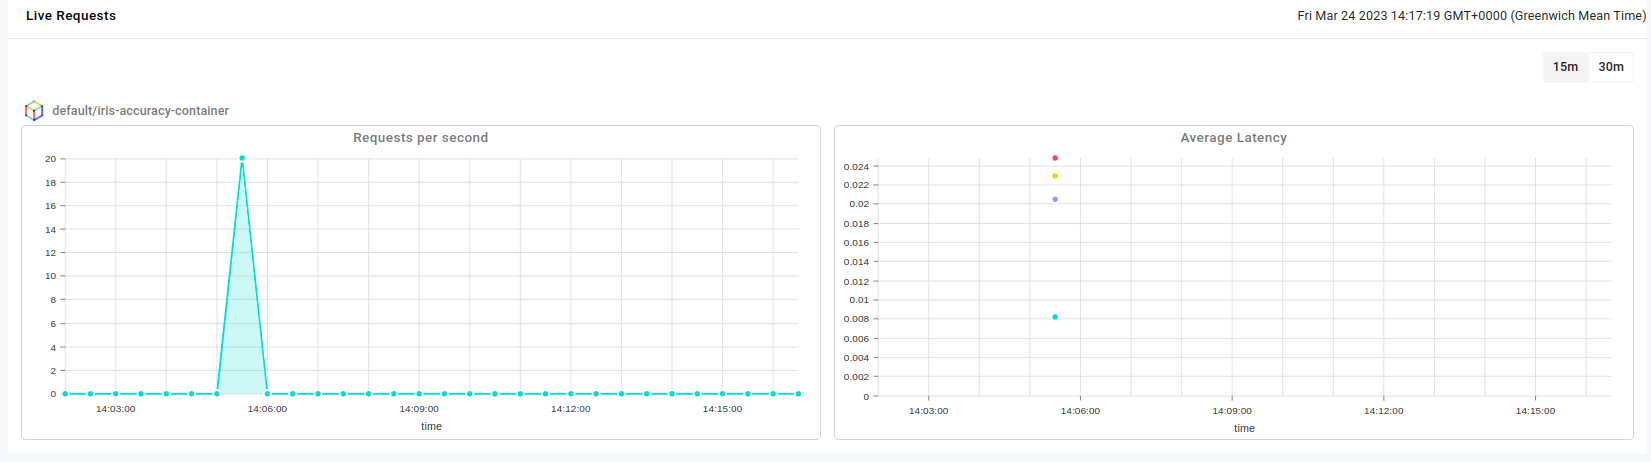
Live Requests
The Live Requests section provides a summary of the traffic going through your deployment, including request rates, success/failure rates by status code, and average latency.
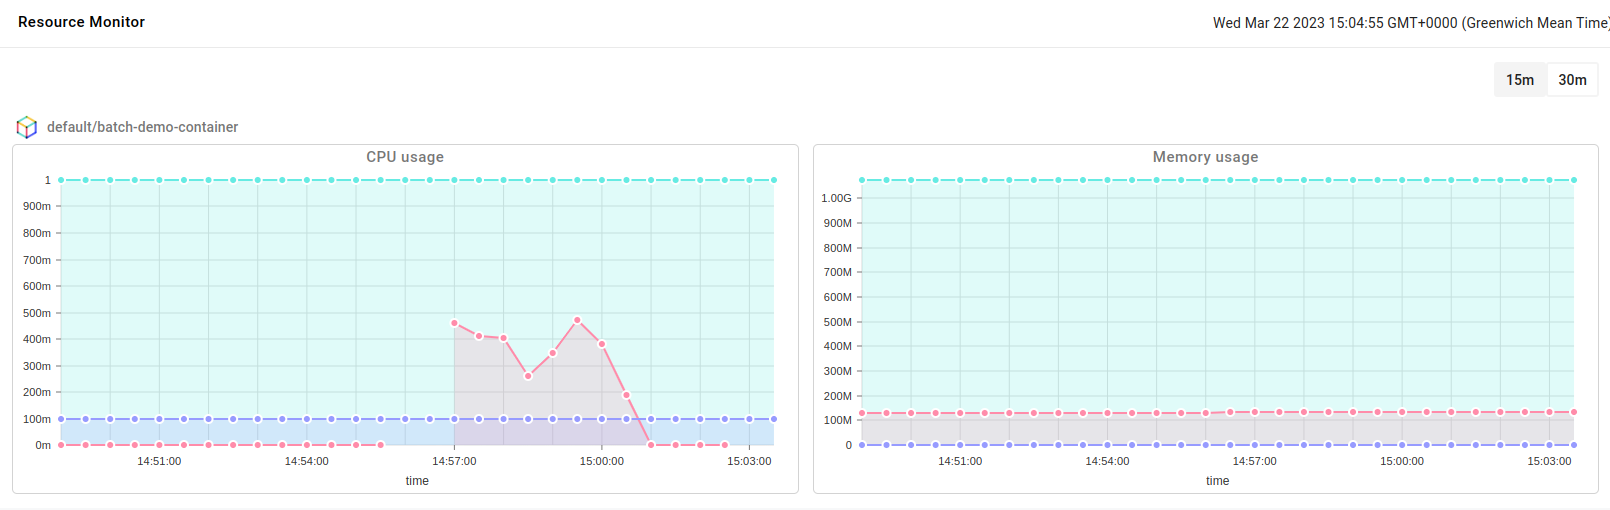
Resource Monitor
For deployments of type Seldon Deployment, there is a Resource Monitor section that reports metrics for CPU and memory usage with utilization rates and limits.
Predict
In the Predict page, you can make prediction requests by either providing a JSON object directly or uploading a file containing a JSON object. The response body is shown on the right, with the HTTP status code and response time.
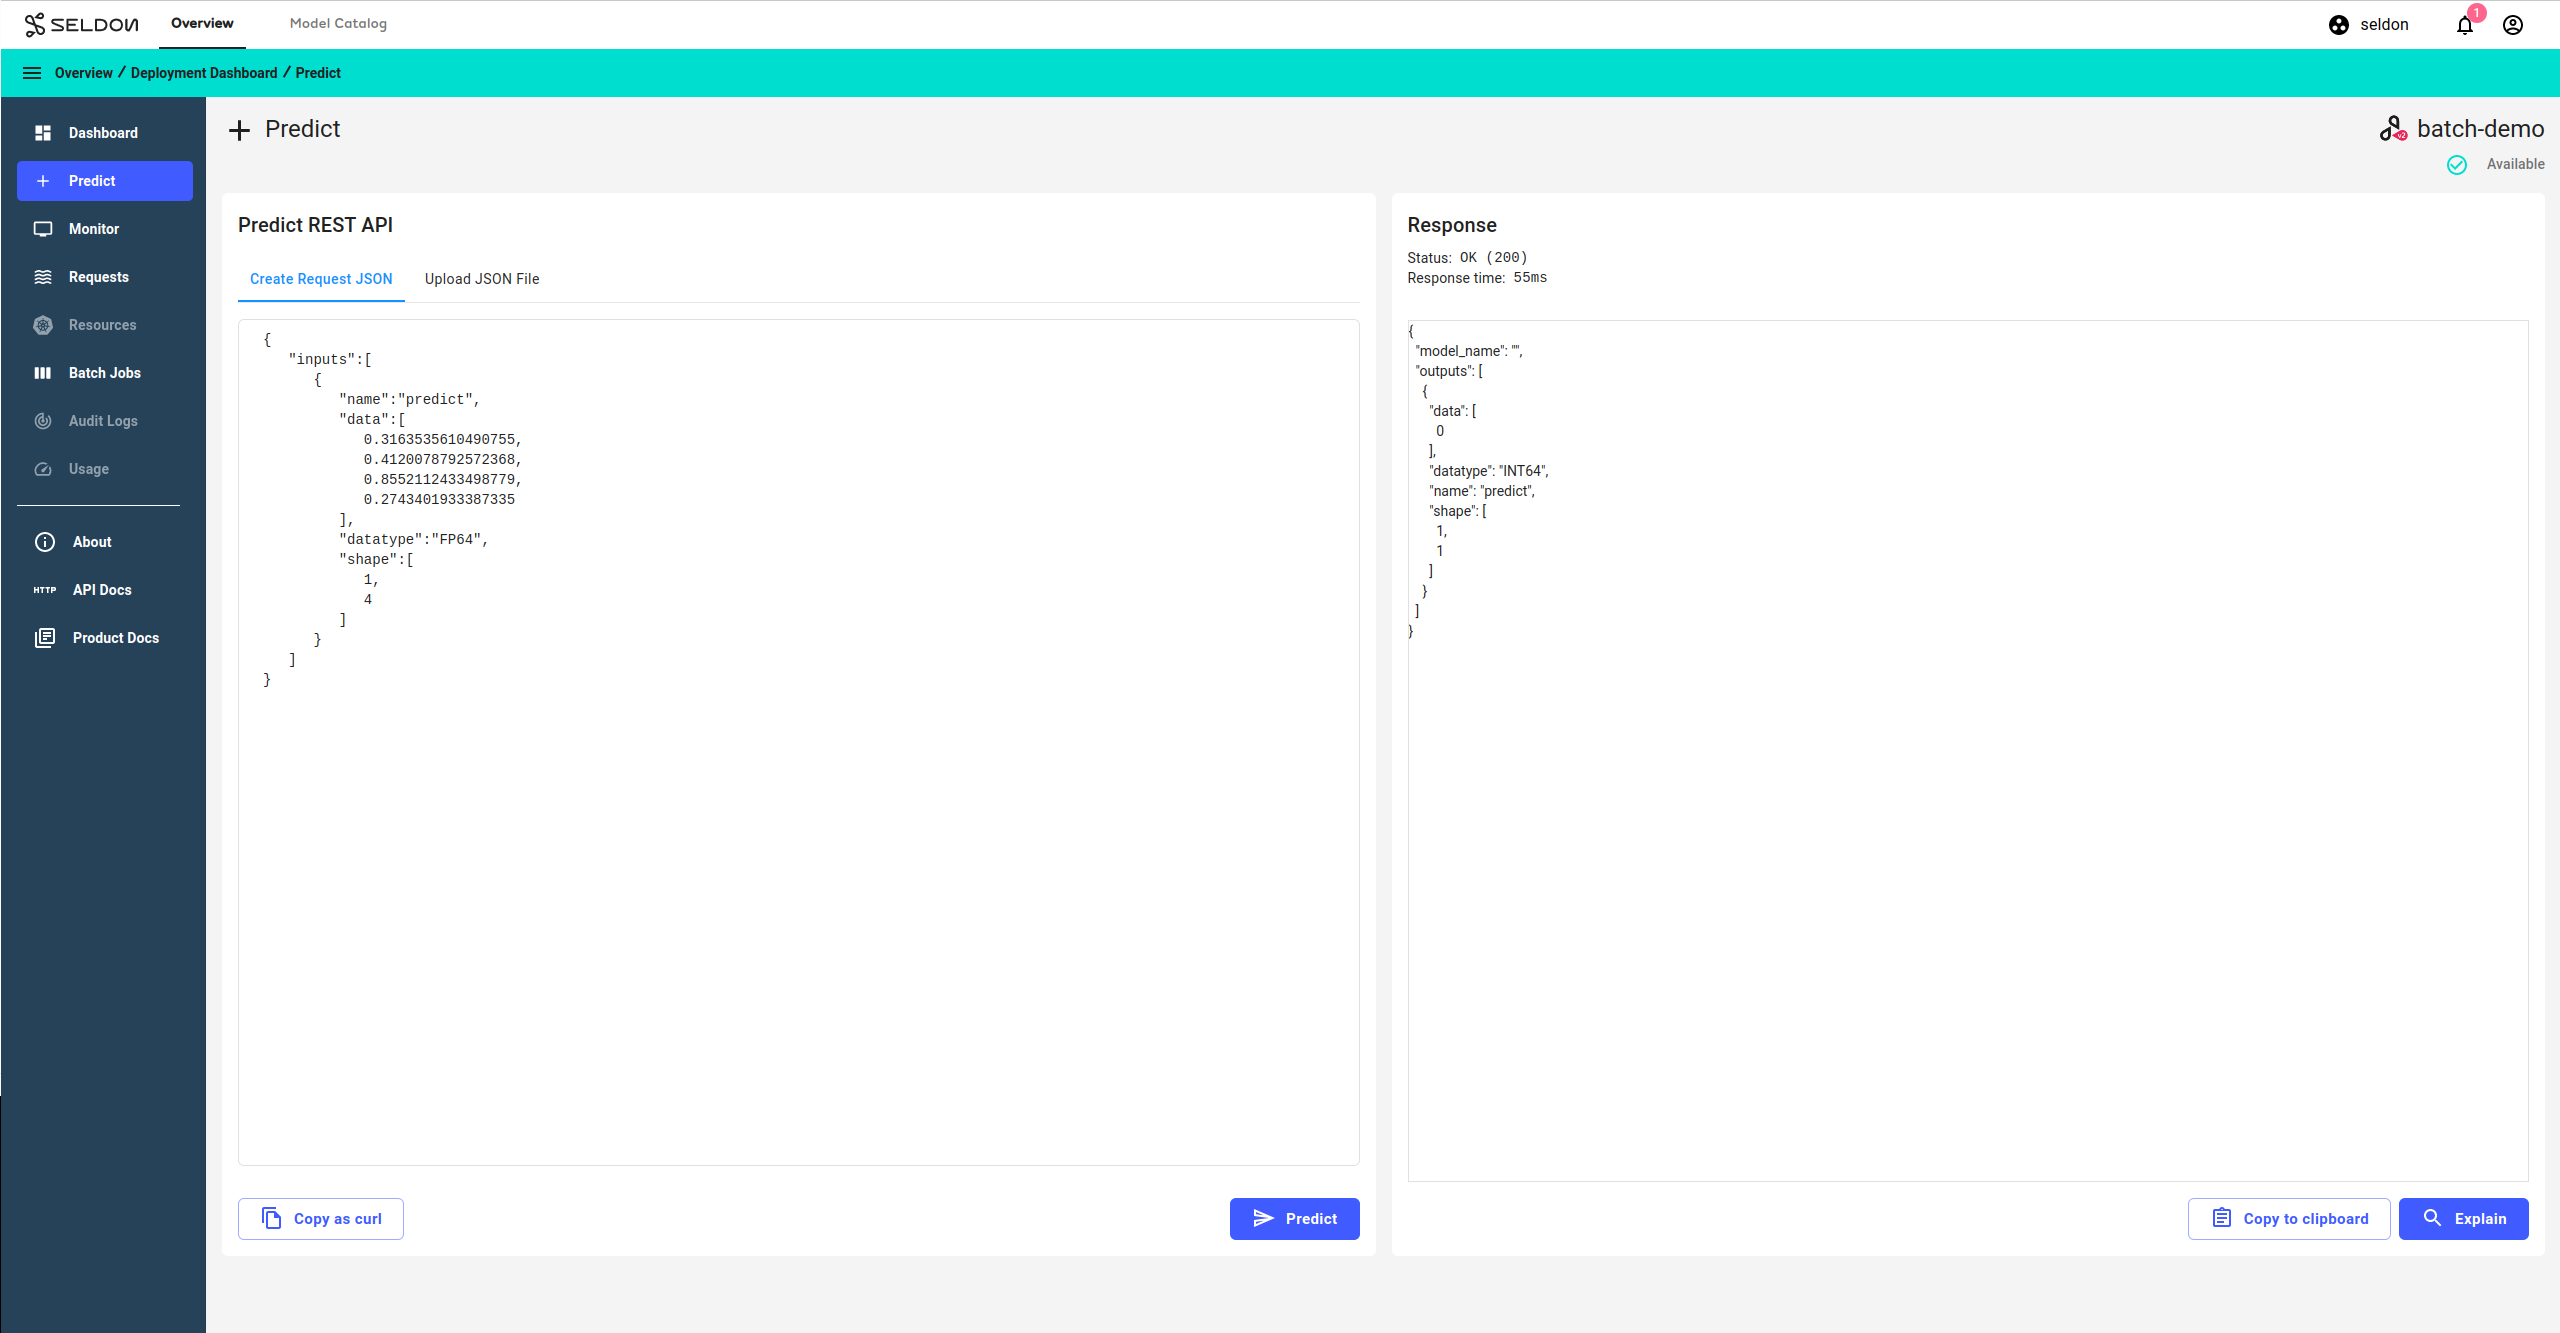
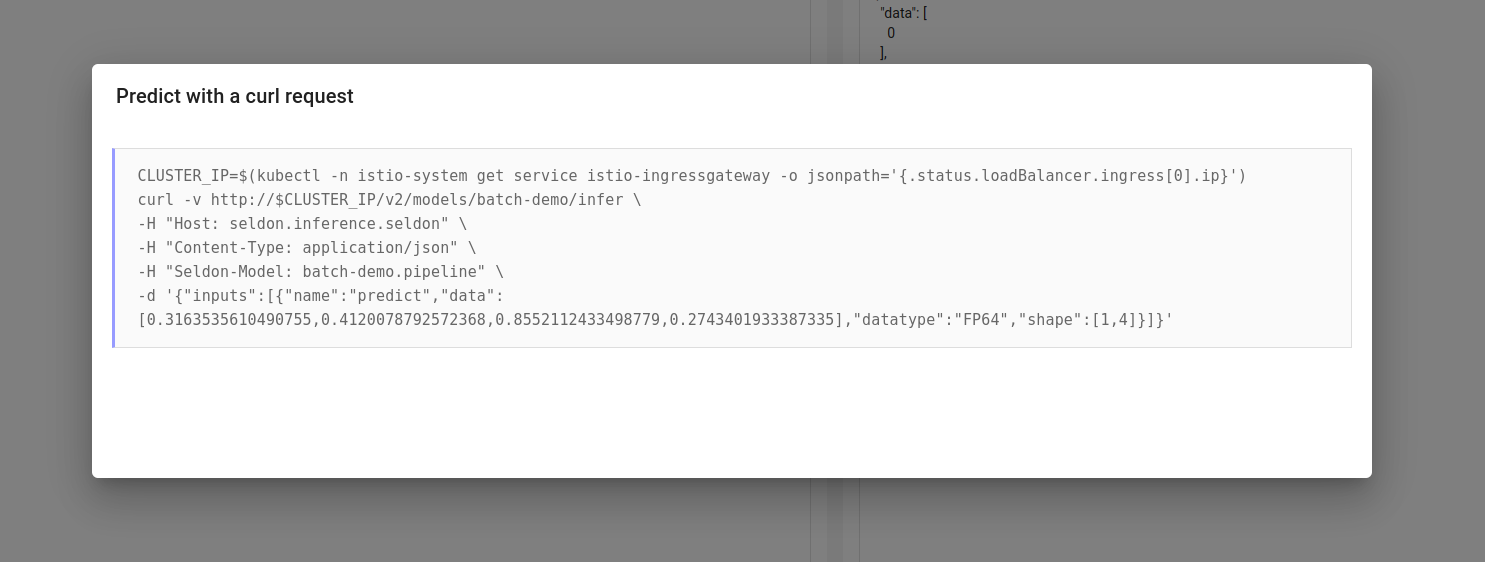
In the lower left part of this page, you can click on the Copy as curl button to display commands to make the same request via a CLI.
Monitor
In the Monitor page, you can inspect various types of distribution trends and characteristics based on your inference requests.
You can see the inference requests by clicking on the View Requests button, which takes you to the Requests page introduced in the next section.
Distributions
In the first tab, Distributions, you can see visualizations of feature distributions and statistics, as well as changes in these distributions over time.
Clicking on the Add reference data button will open a wizard to import your reference data, which will be displayed alongside the distributions from the inference requests for comparison.
Each row is collapsible with a click.
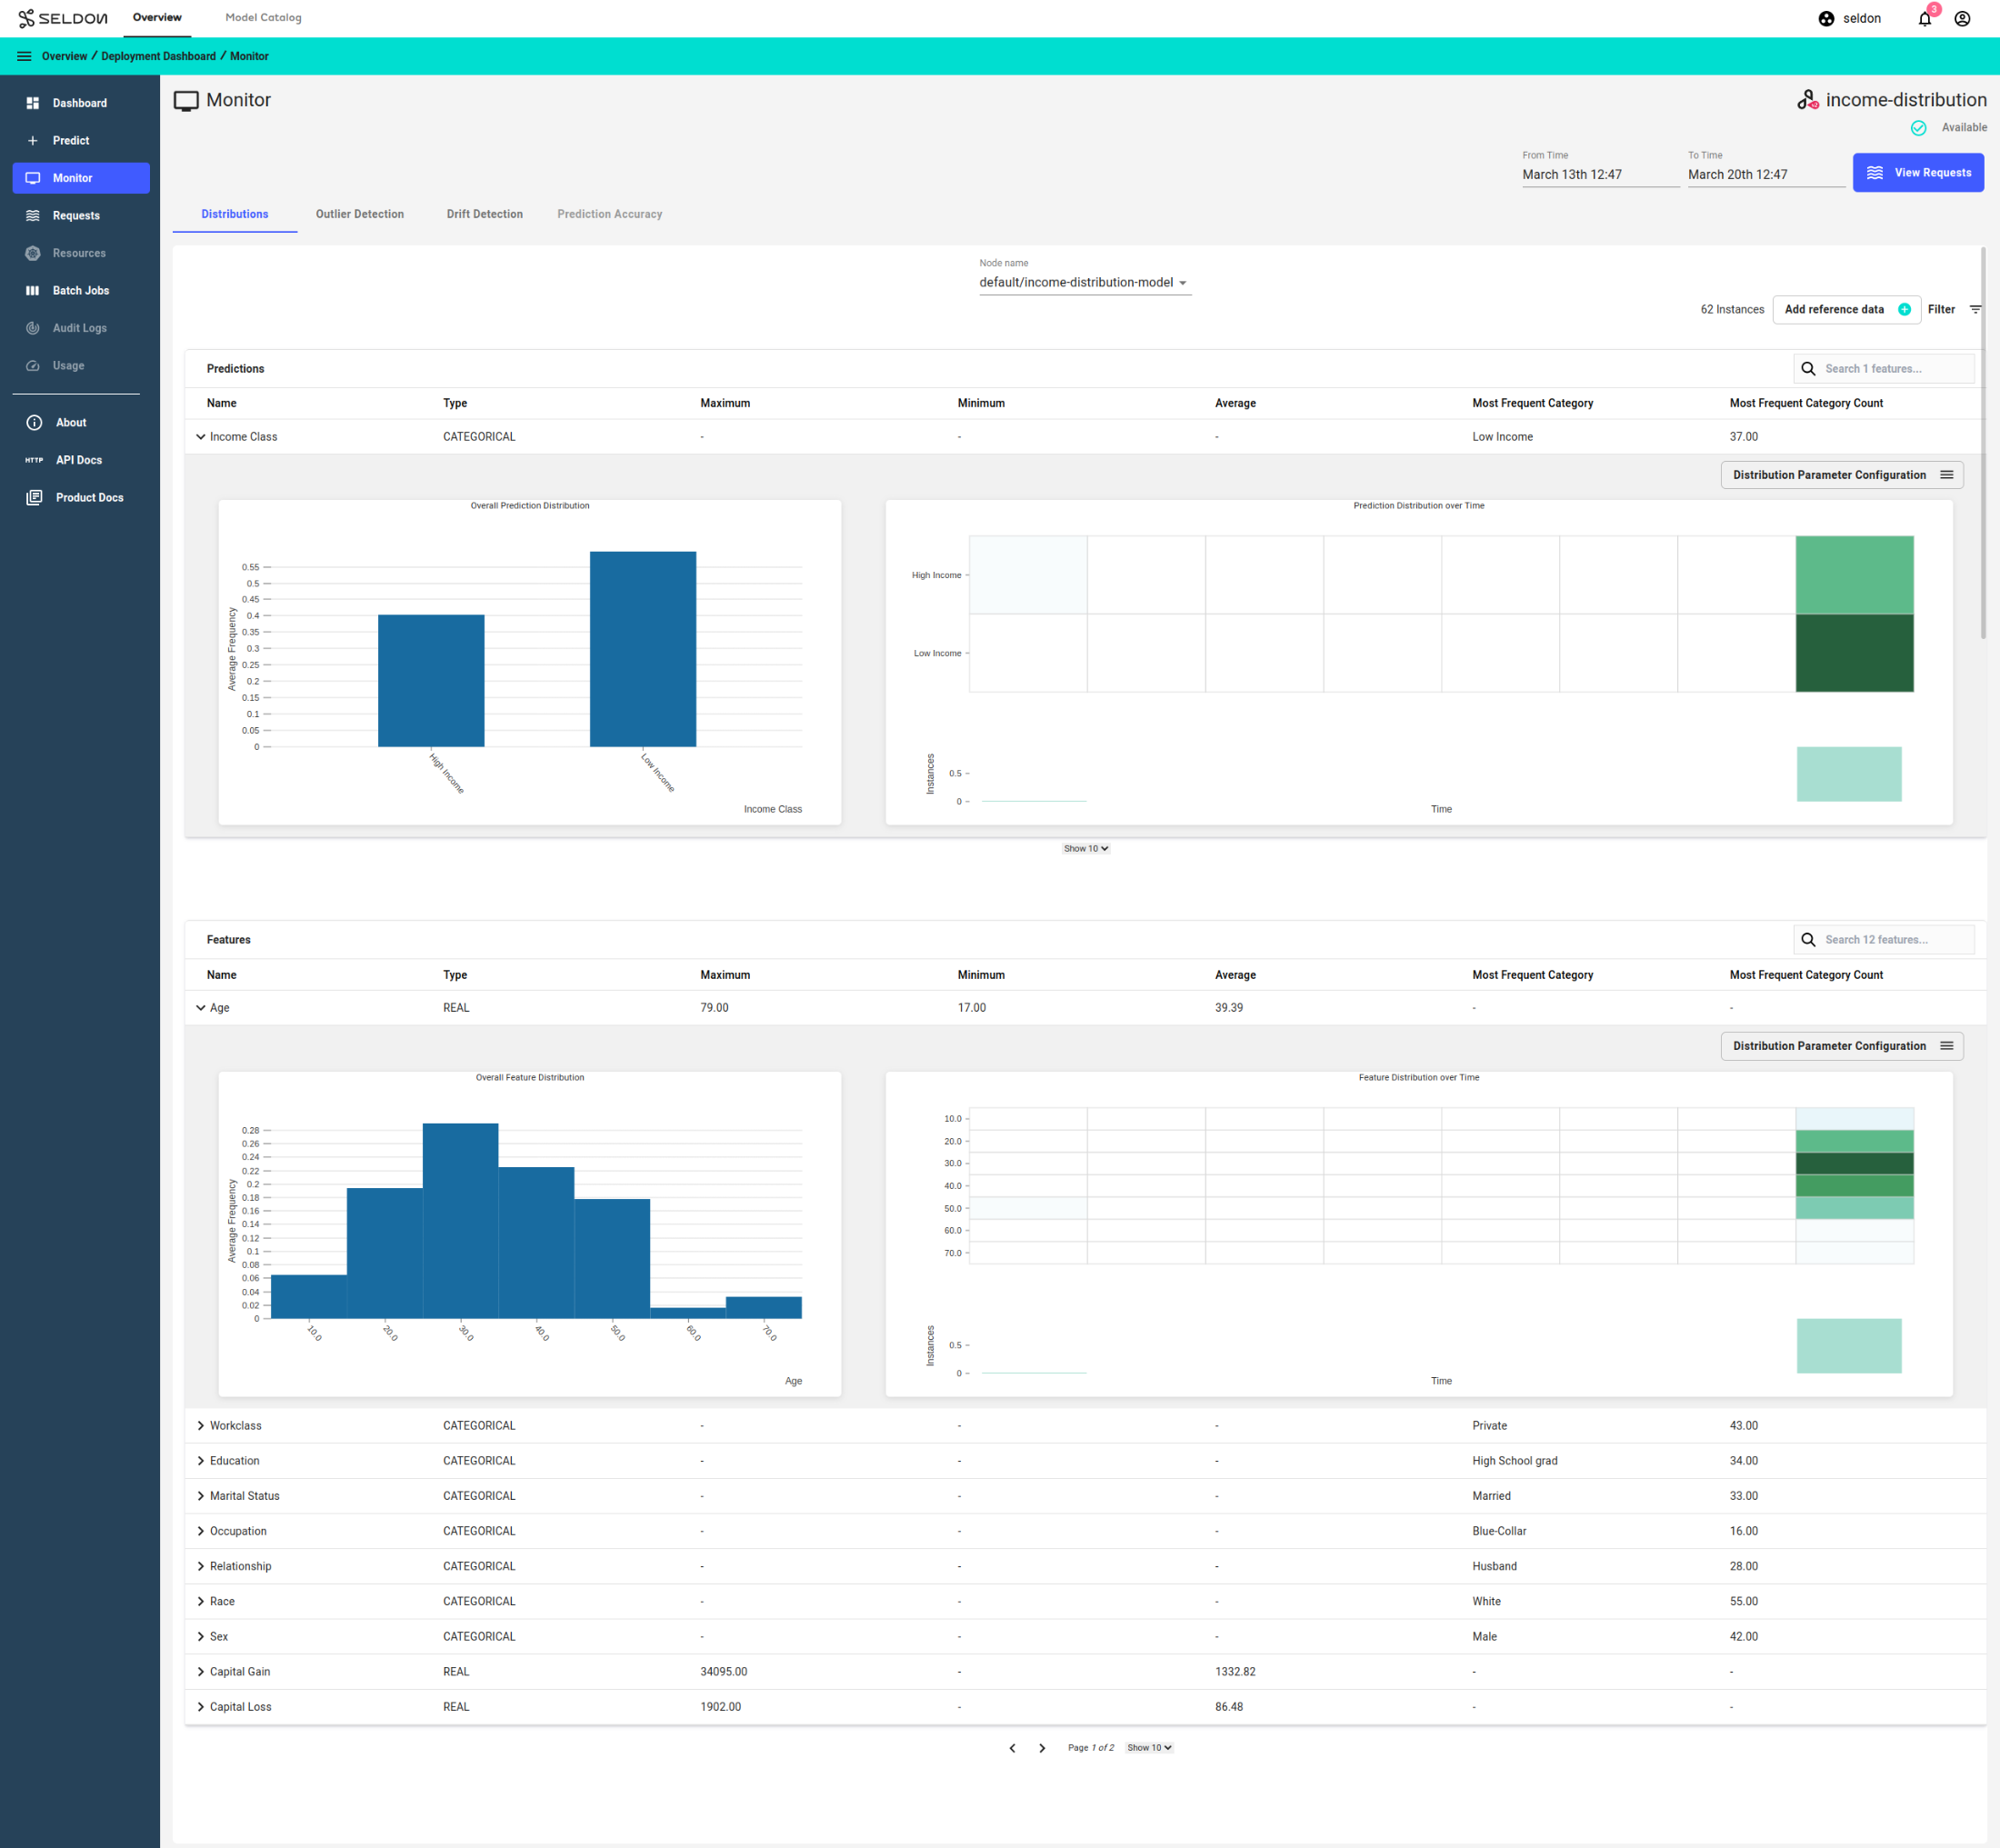
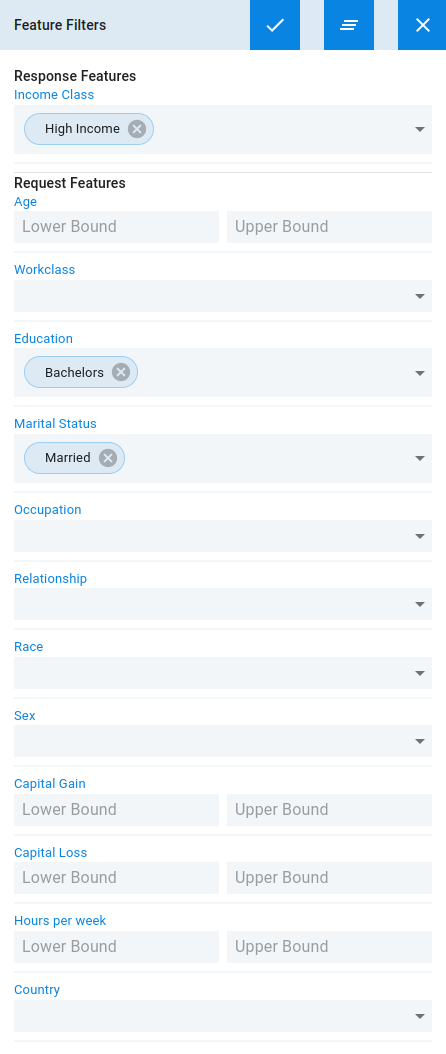
This functionality also enables you to draw comparisons for different combinations of features and time slices by choosing appropriate filters from the Filter button on the right.
See the following demos for a step-by-step guide for distributions monitoring.
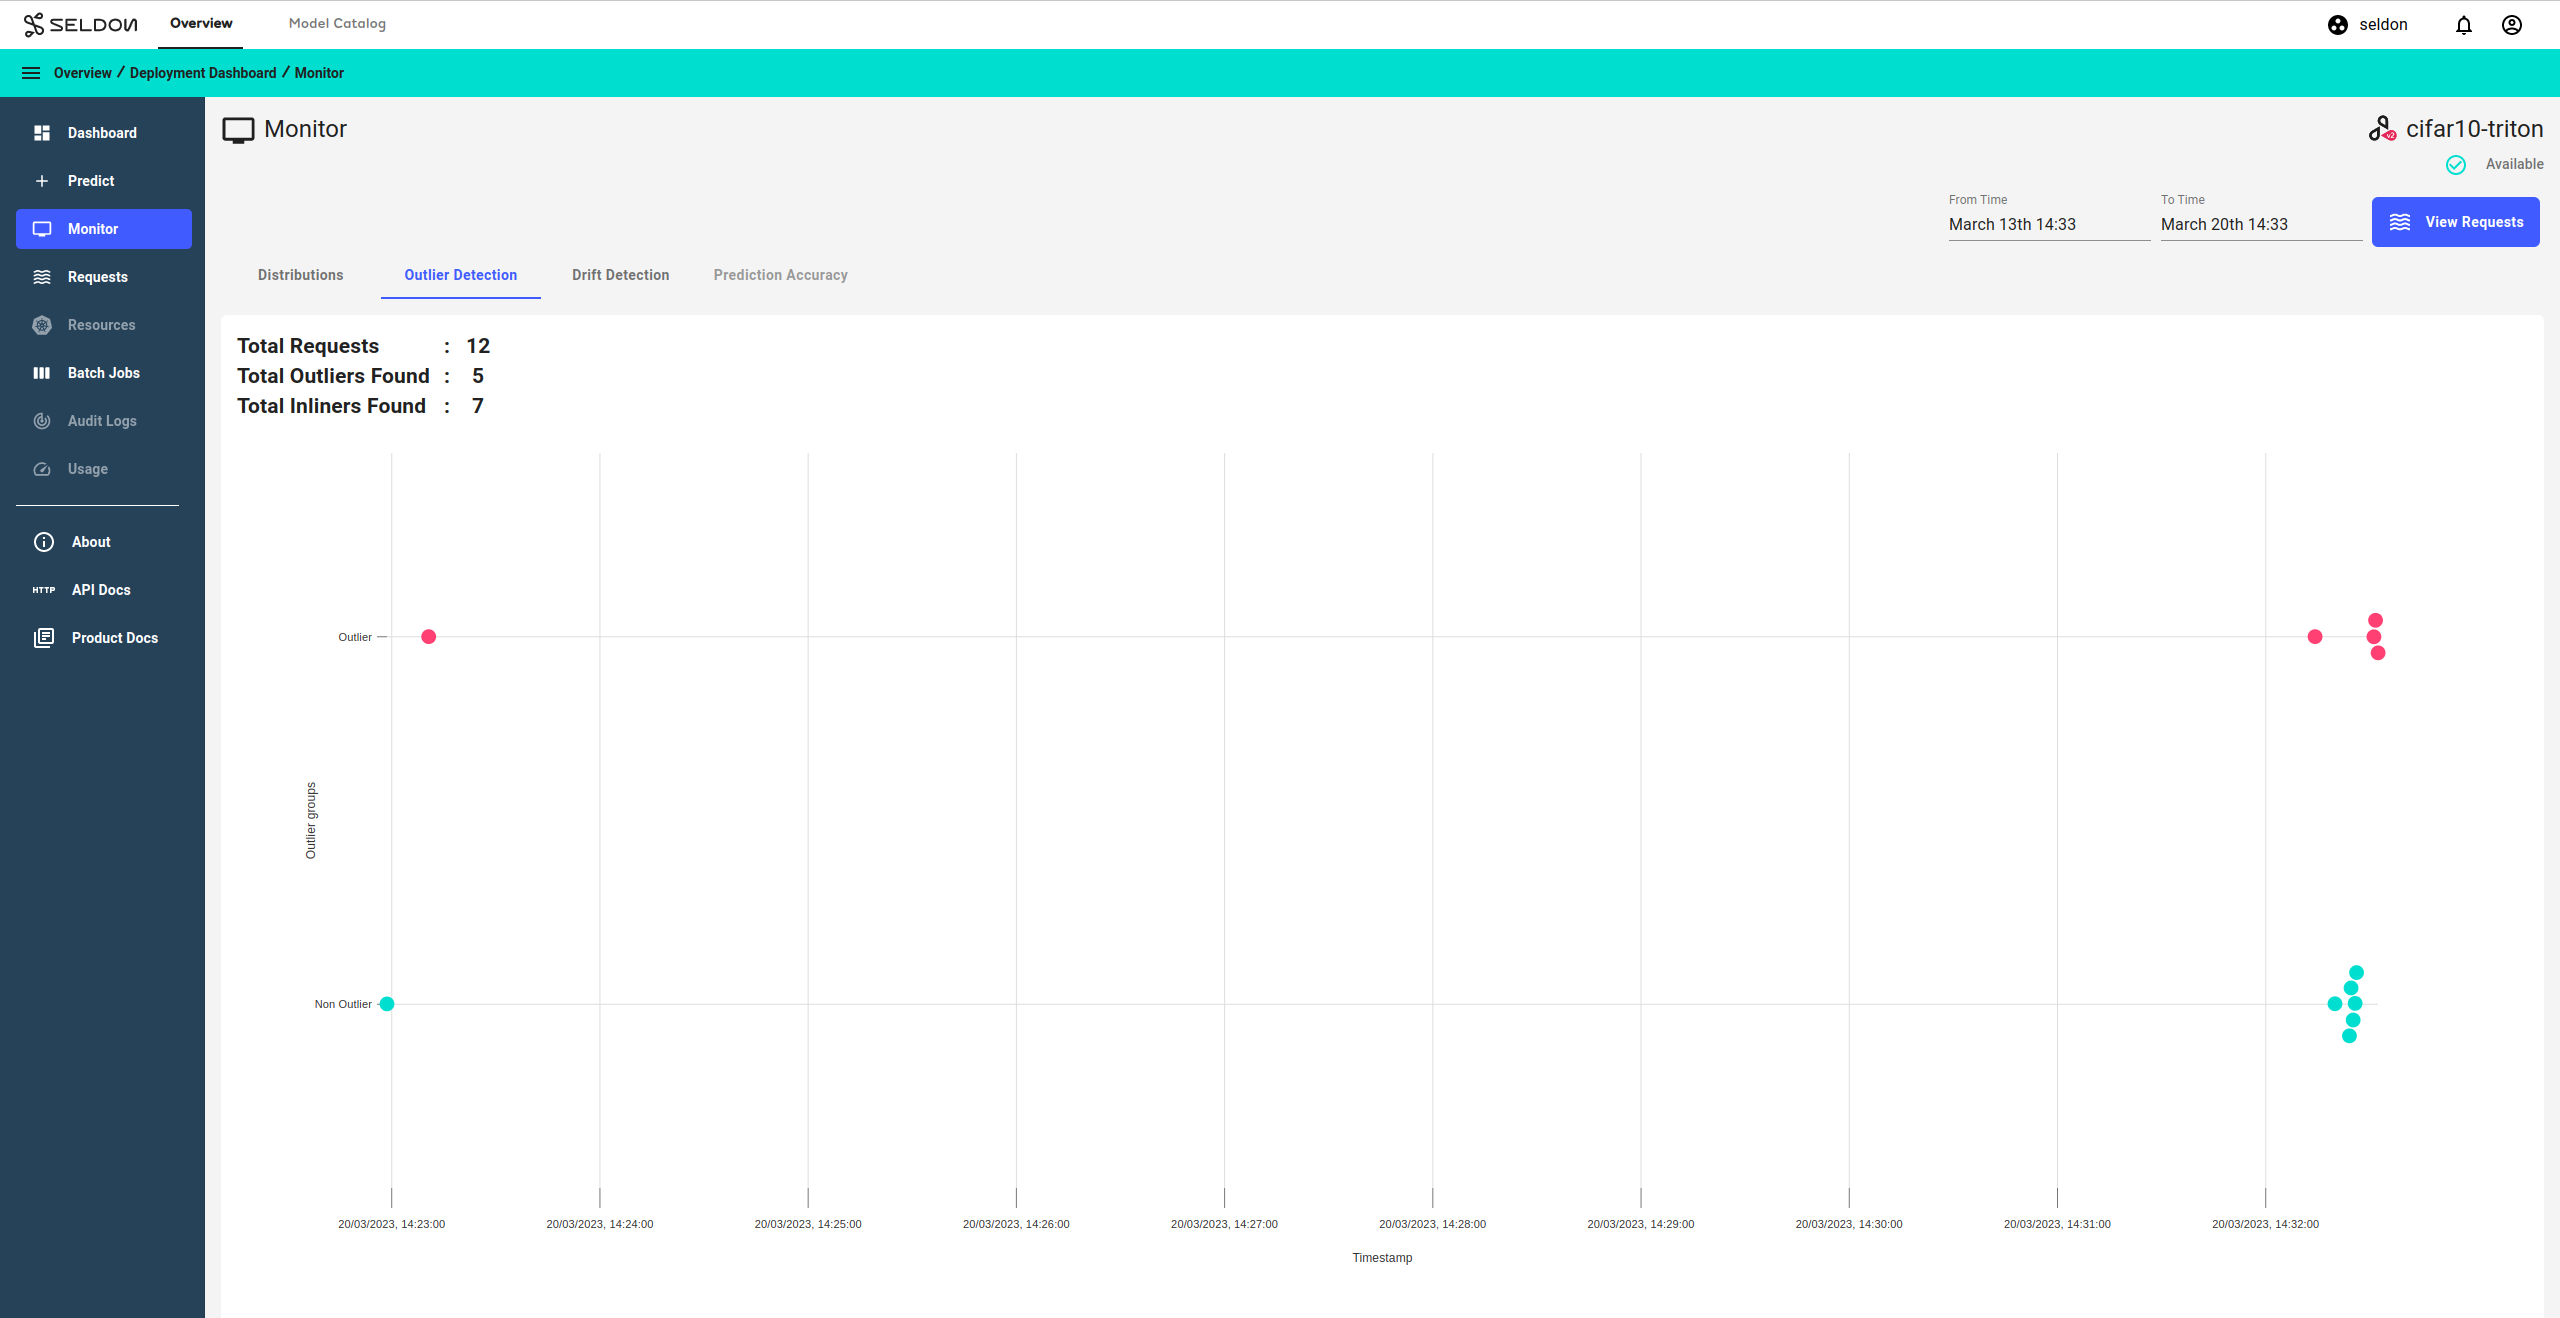
Outlier Detection
In the second tab, Outlier Detection, you can see the timestamps and outlier/inlier groups for inference data.
Red dots indicate outliers and blue dots indicate inliers.
See the following demos for a step-by-step guide for outlier detection using image classification models.
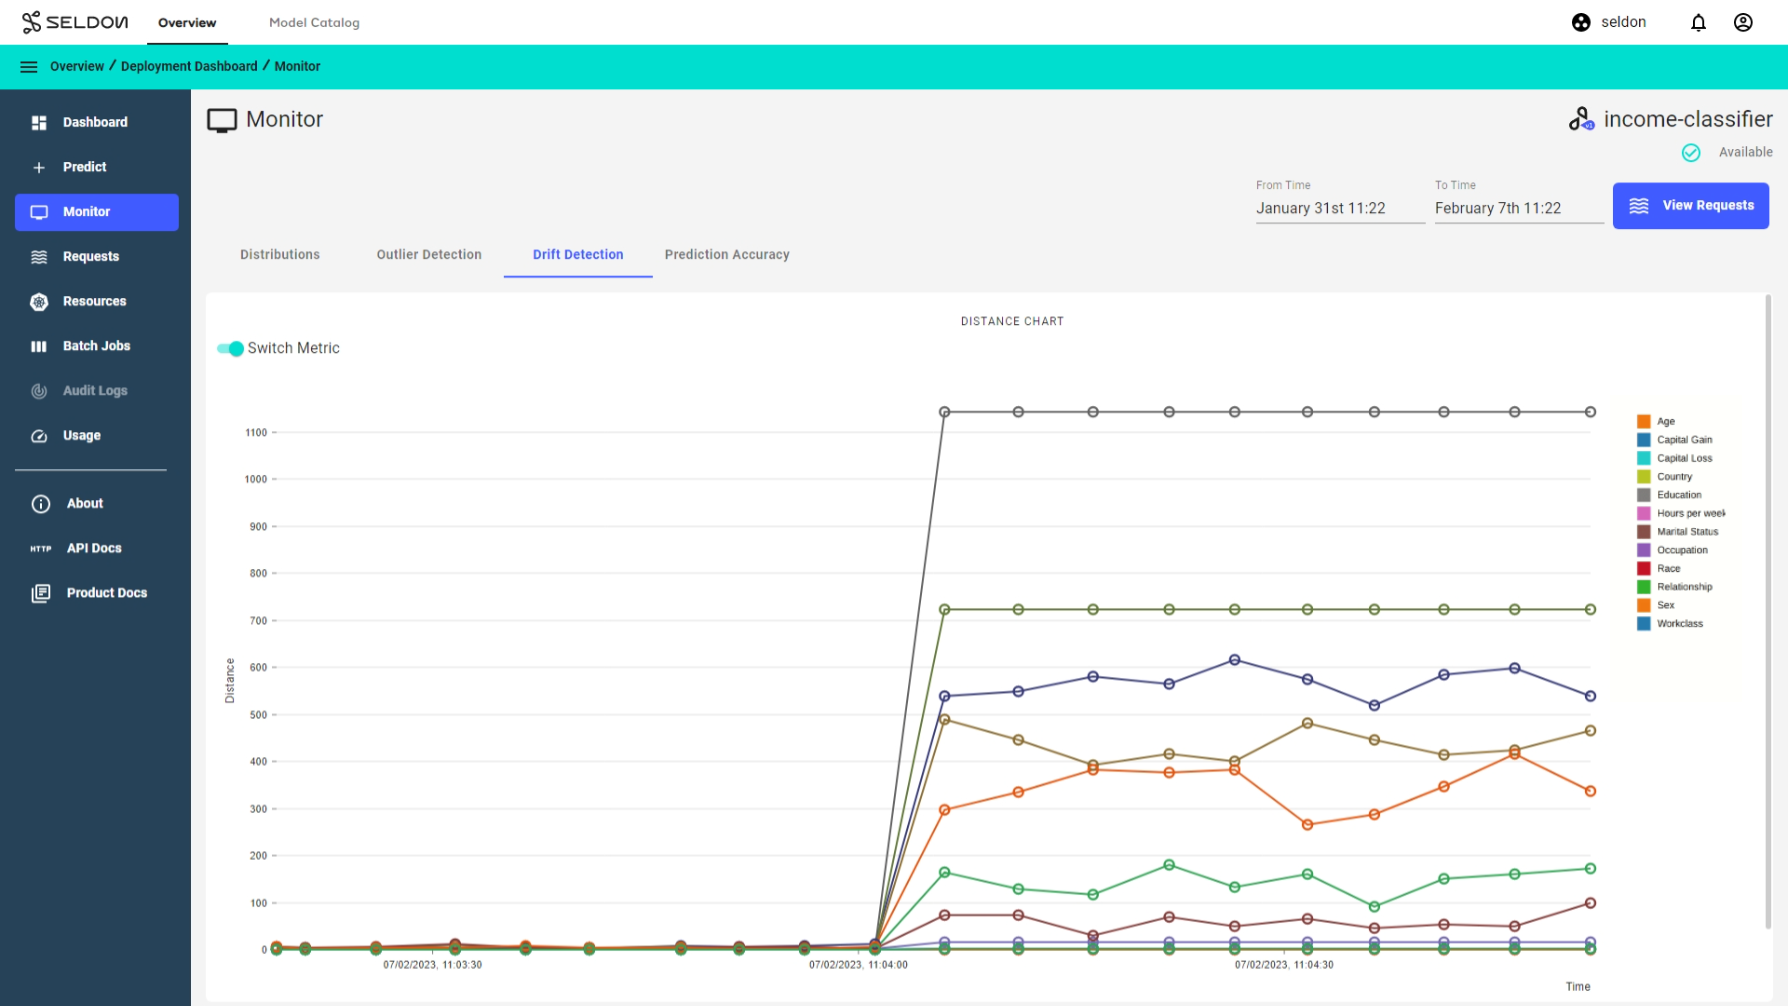
Drift Detection
In the third tab, Drift Detection, you can see the significance of changes in feature distributions over time.
The Switch Metric slider will change the views between p-values and distance scores.
See the following demos for a step-by-step guide for outlier detection using tabular classification models.
Requests
In the Requests page, you can investigate individual inference requests and responses with explainers and outlier detectors. The results can be filtered by the menu on the right, where you can specify time ranges as well as request IDs.
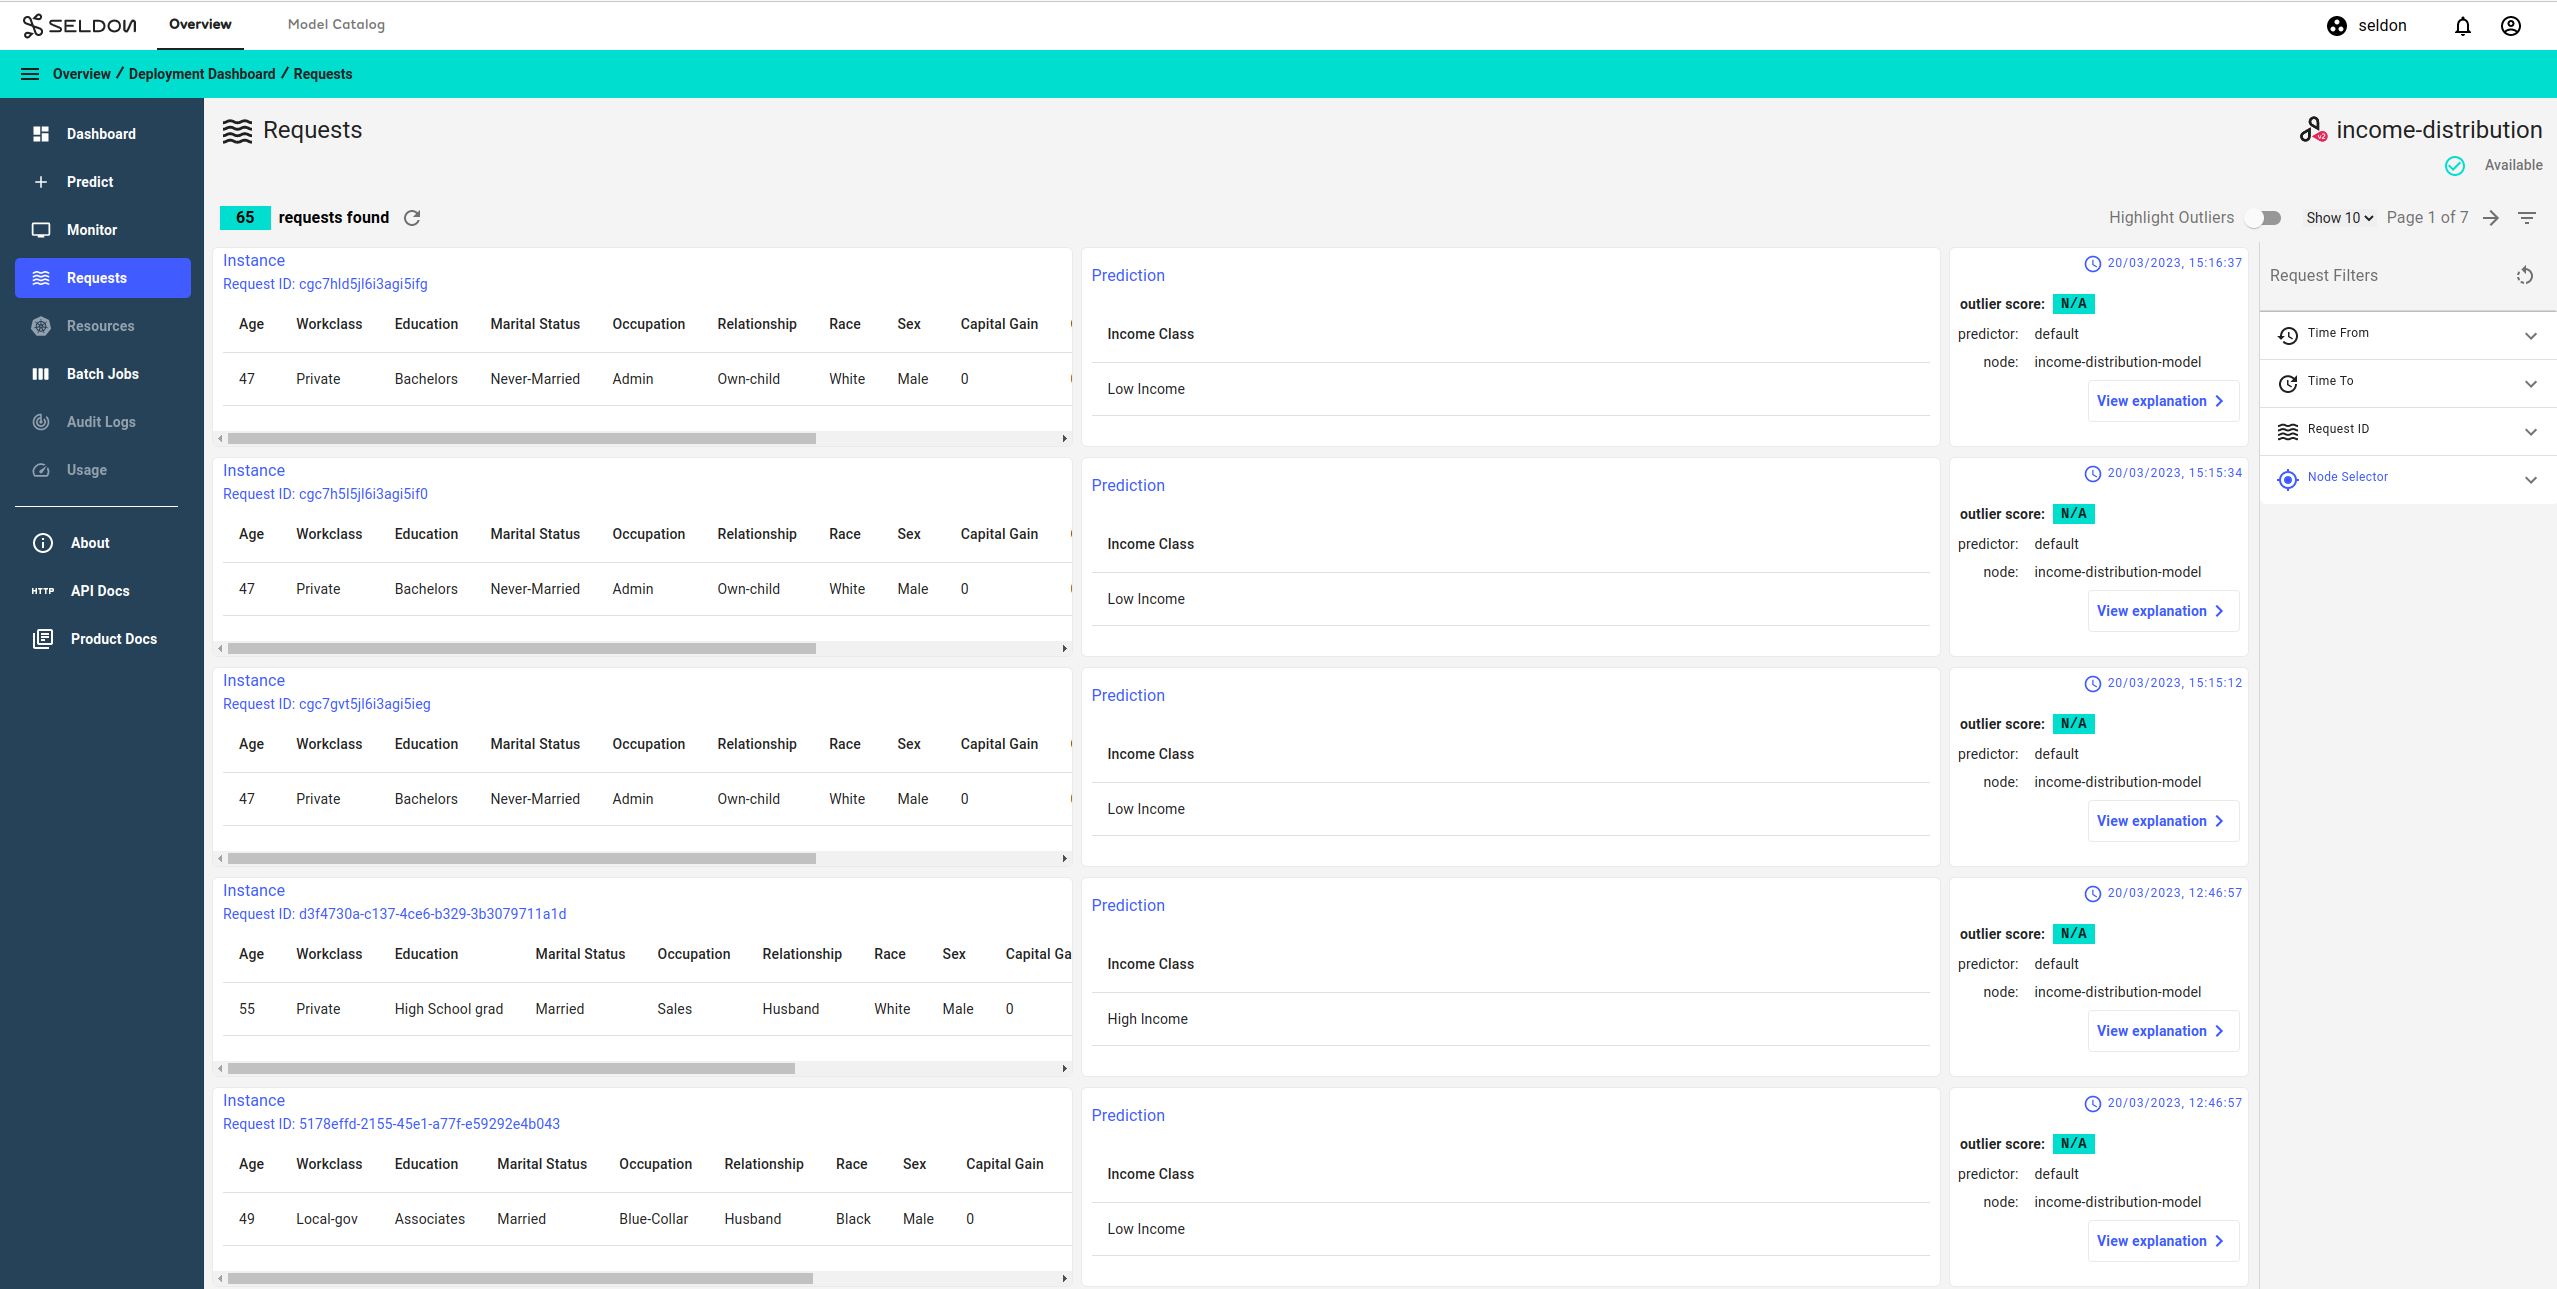
If an outlier detector is configured, it will show an outlier score to the right.
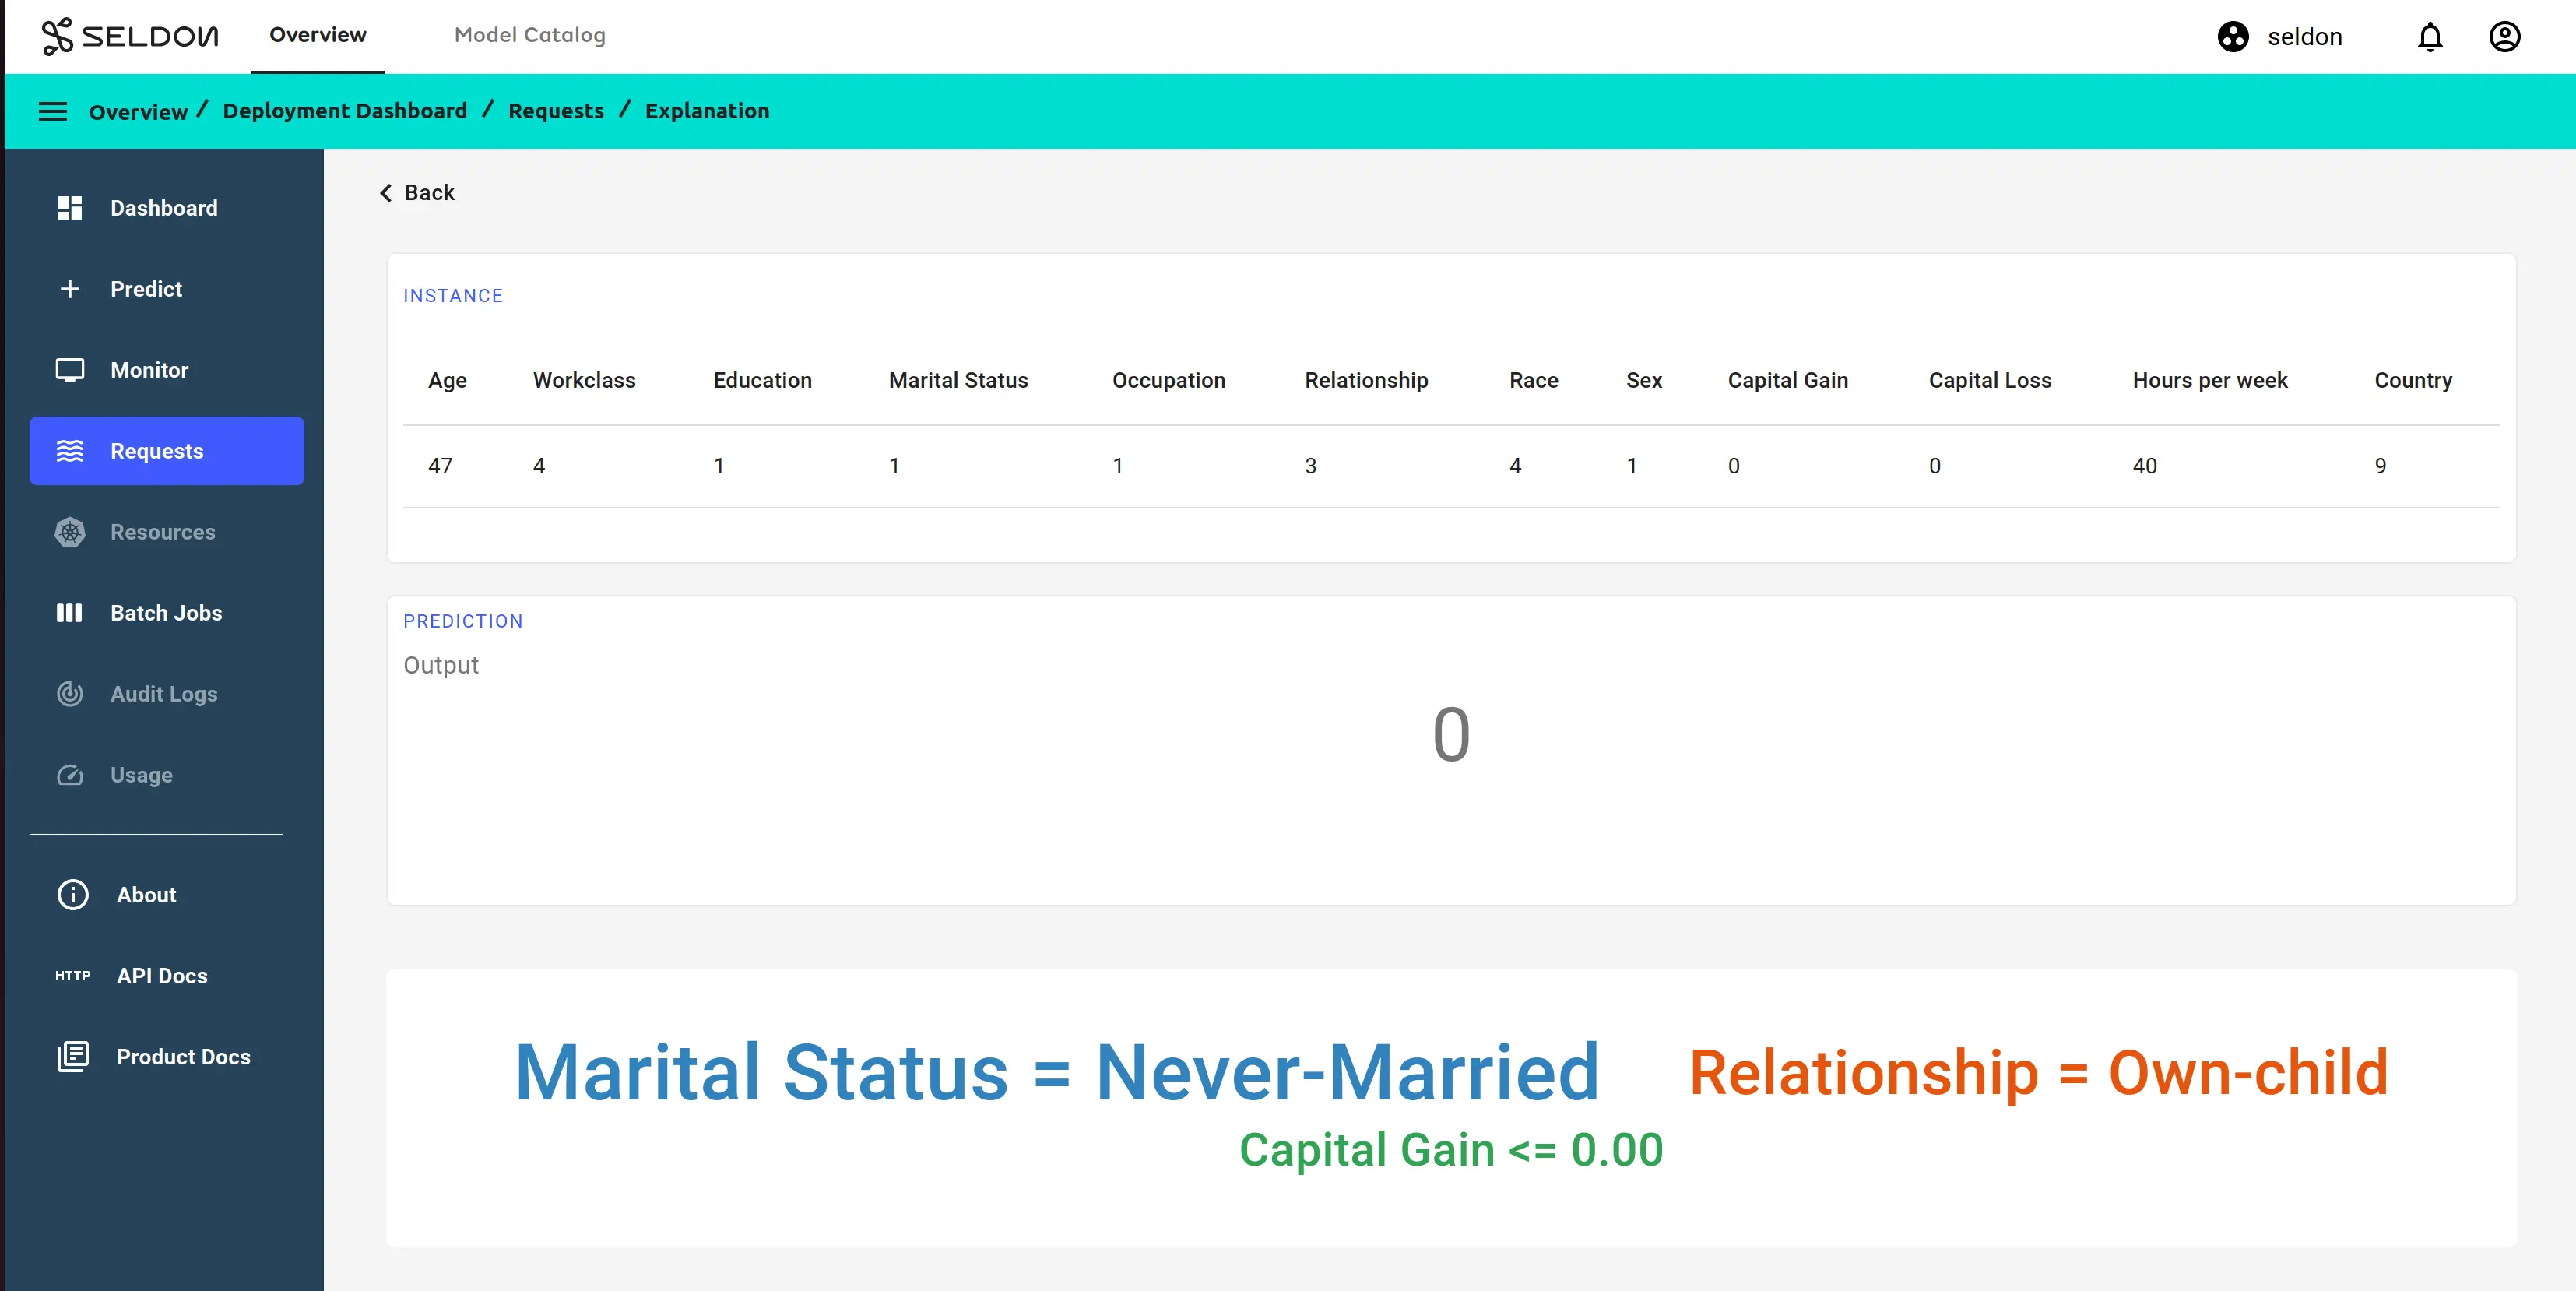
Likewise, if an explainer is configured, you can generate a model explanation from the View explanation button.
Resources
In the Resources page, you can inspect Kubernetes resources for Pods, Deployments, and Services, displaying relevant information such as replicas, namespaces, and cluster IPs.
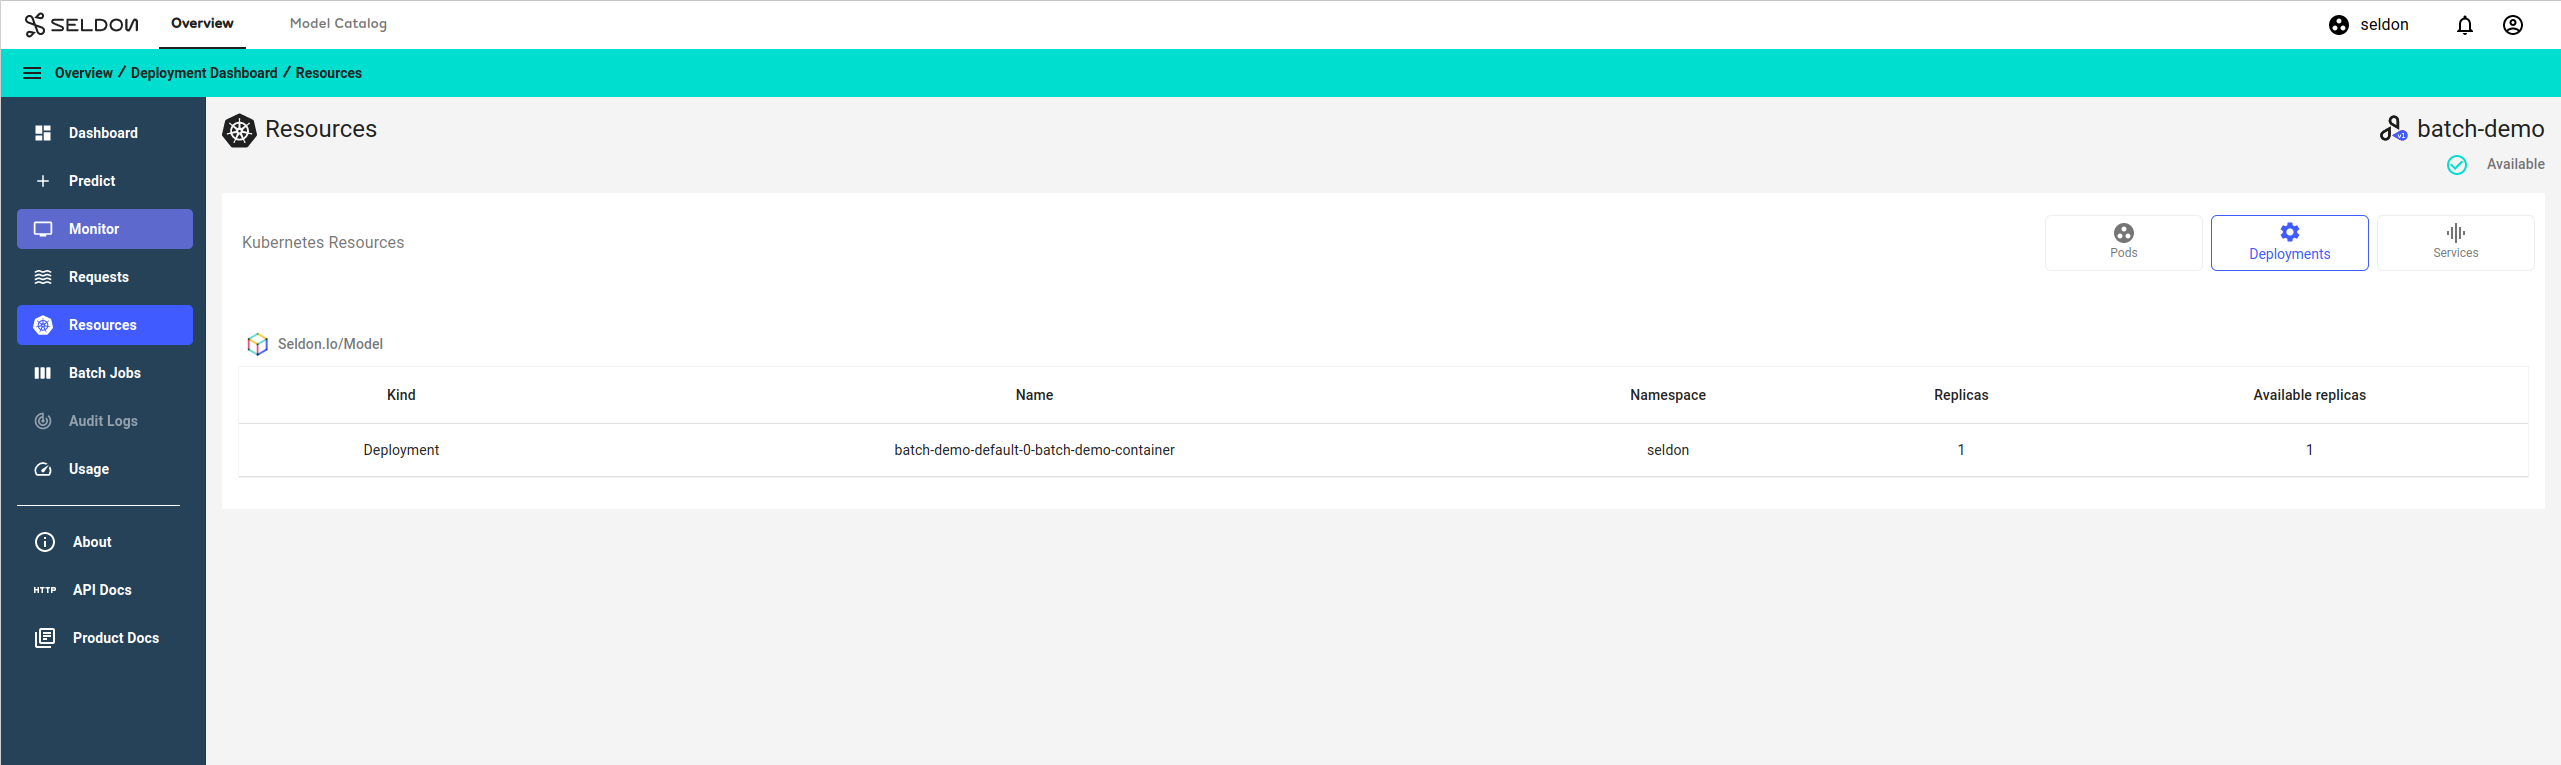
Note
The Resources page is only available for deployments of type Seldon Deployment.
Batch Jobs
In the Batch Jobs page, you can create batch jobs for existing data sources, e.g. from cloud storage. In the batch job creation wizard, you can specify input and output locations for your data, as well as batch size, number of parallel workers, and other relevant details.
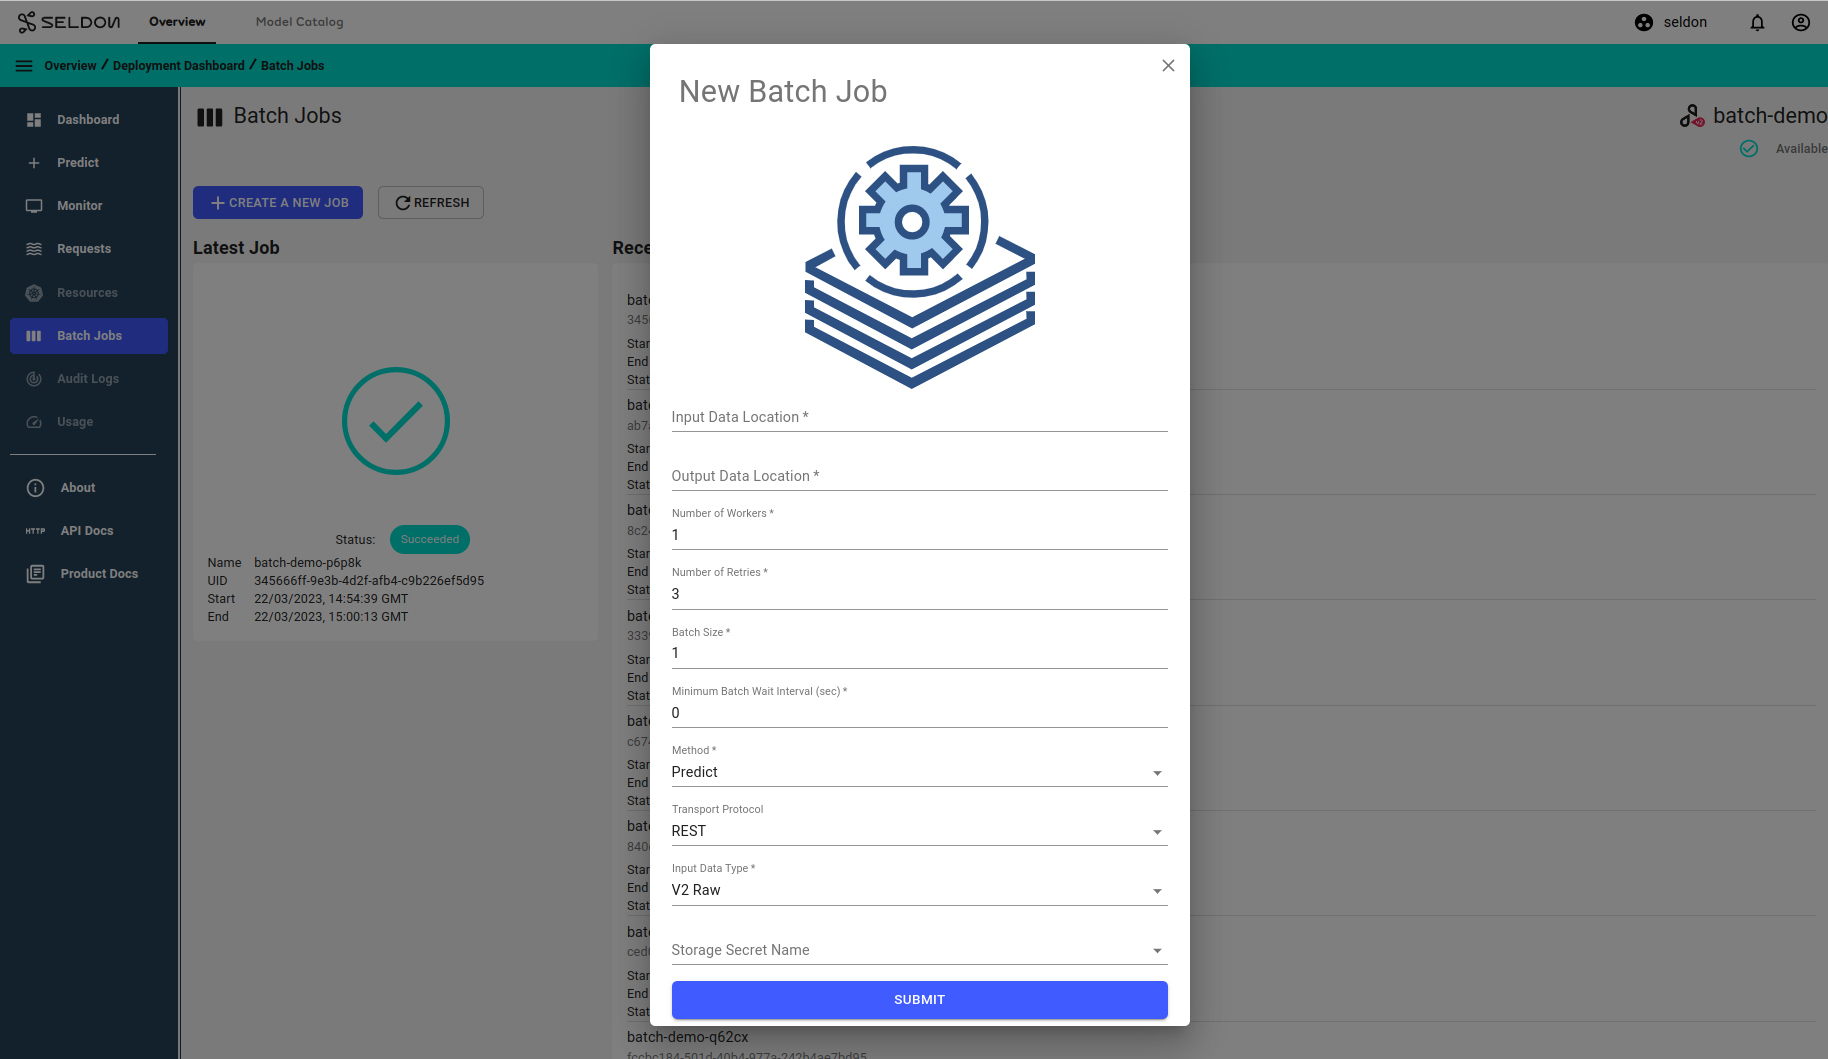
Once the job is done, it will show up in this page with either Succeeded or Failed status.
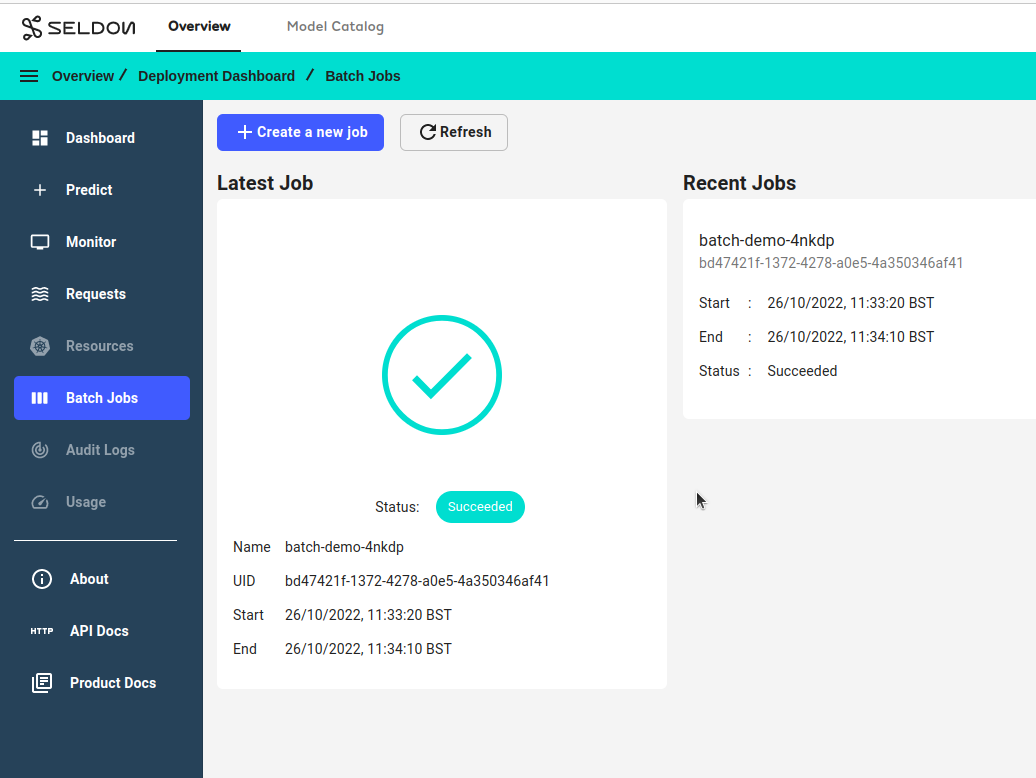
Note
Succeeded indicates that the steps specified in the batch jobs were executed without errors.
Be sure to check the output data as the batch job can succeed even if the input file is empty, etc.
See the following demos for running batch jobs.
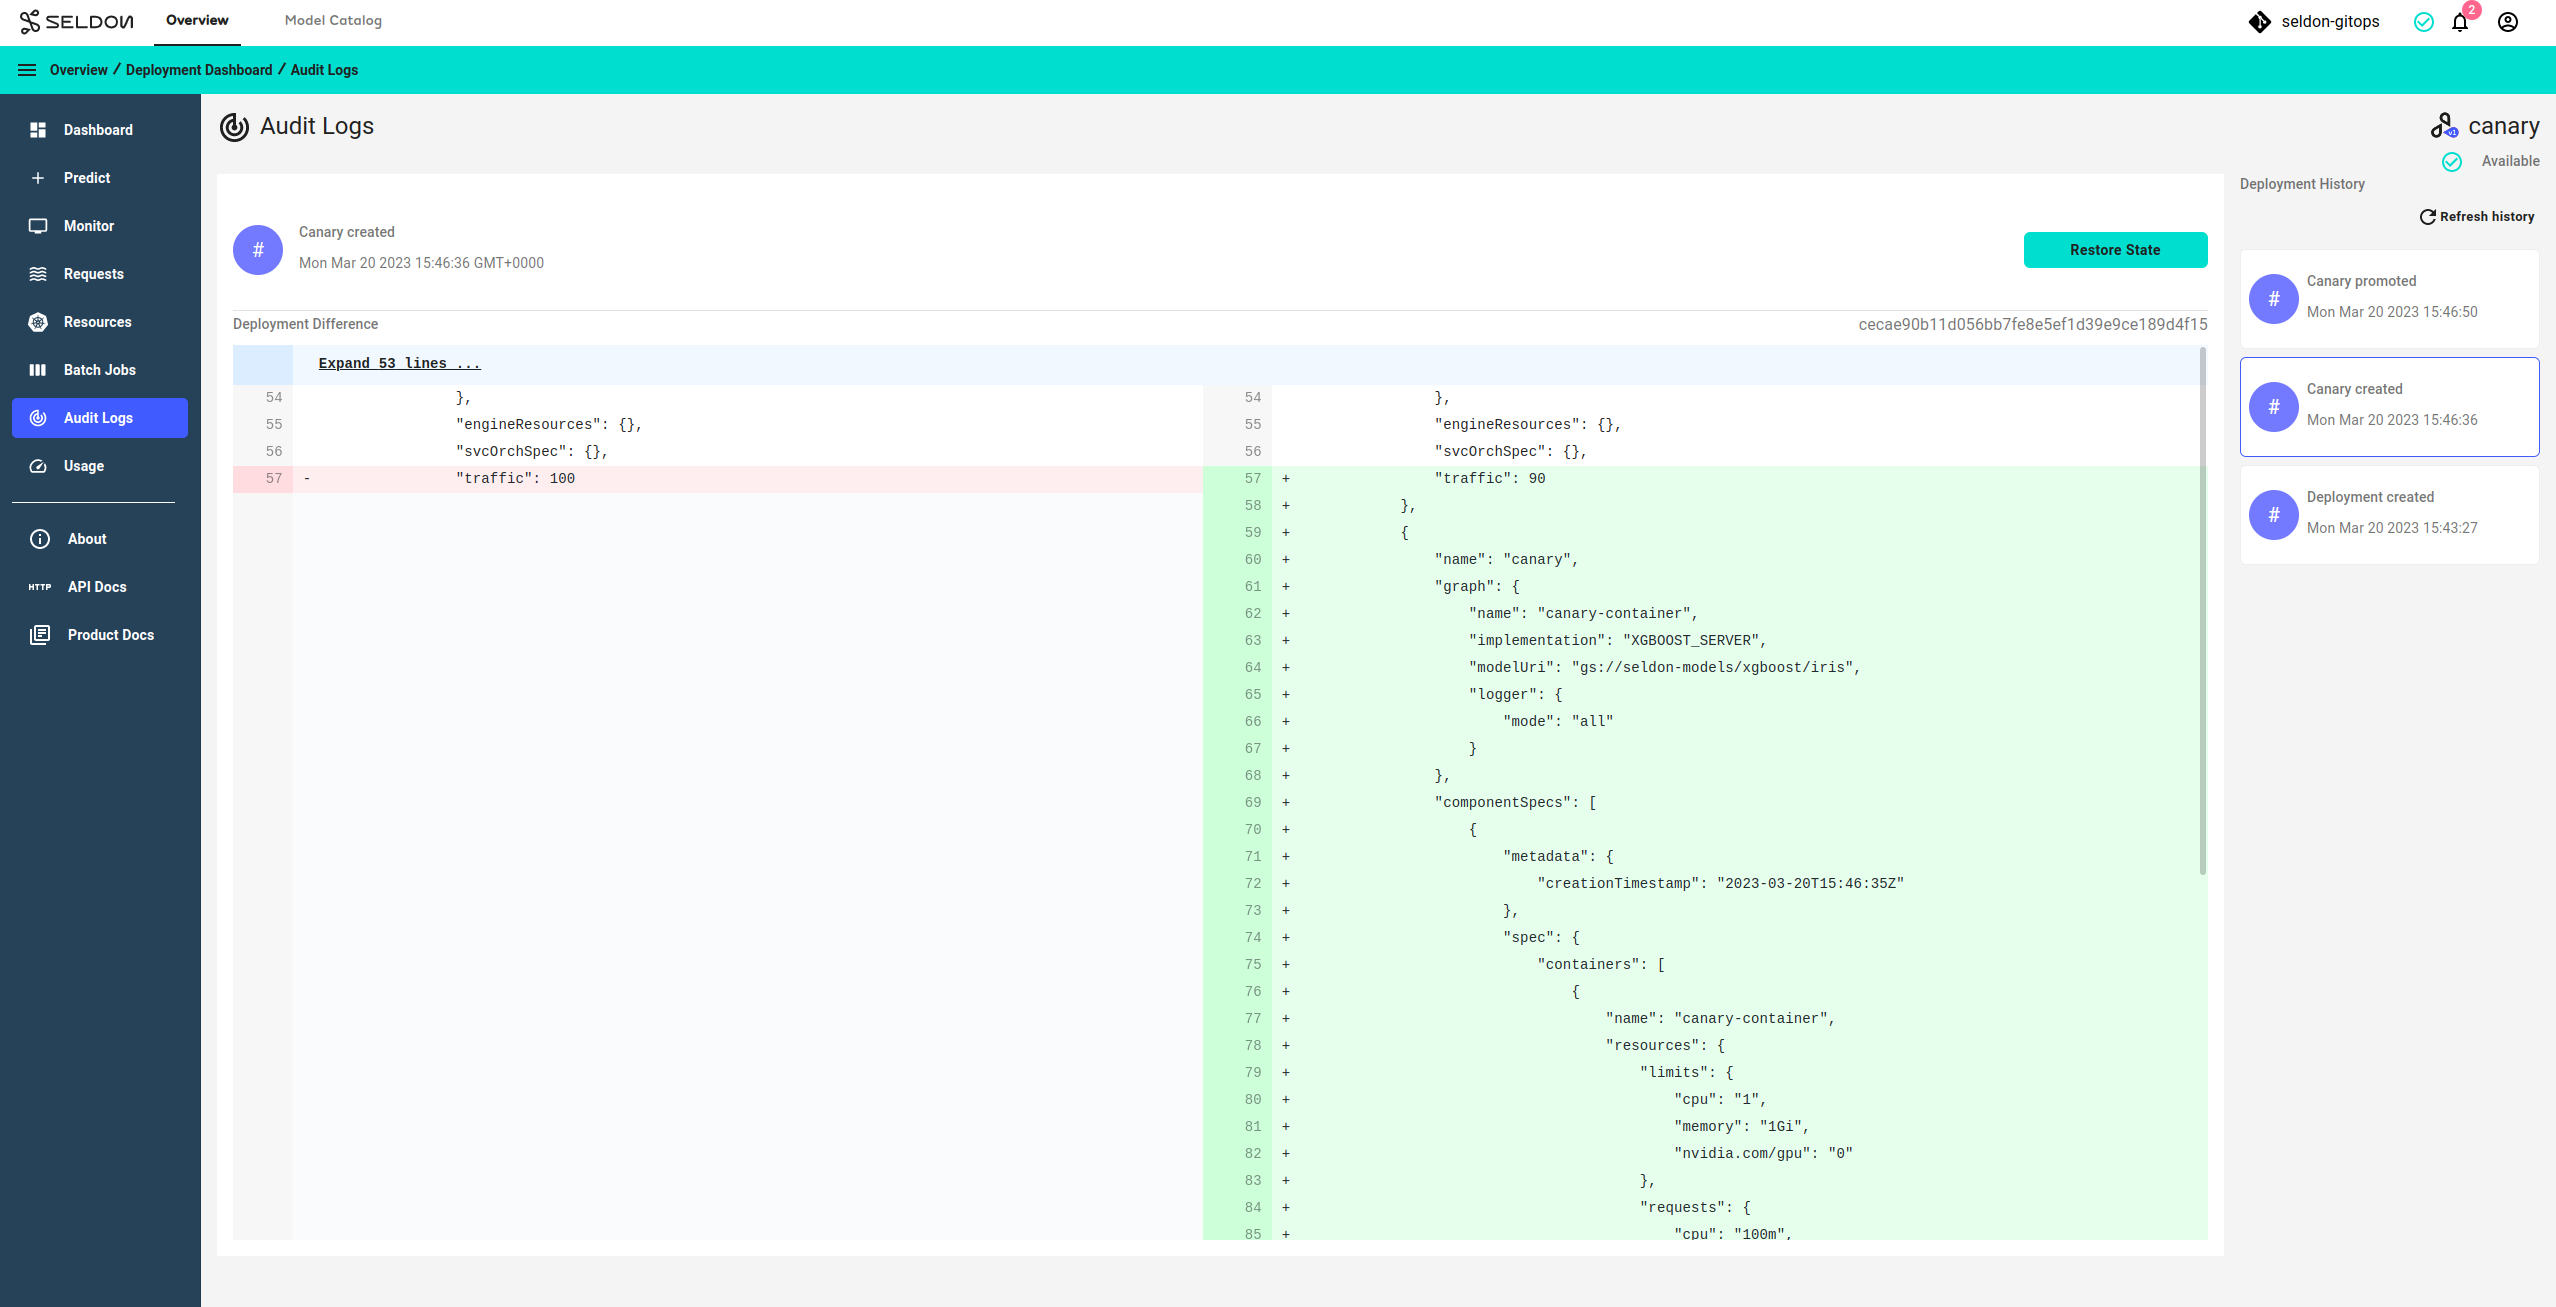
Audit Logs
If GitOps is enabled for the current namespace, the Audit Logs page will show the history of deployment manifest files, with differences, for actions such as adding new models and promoting canaries.
Each action in the UI is registered as a commit, with a description in the Deployment History menu on the right.
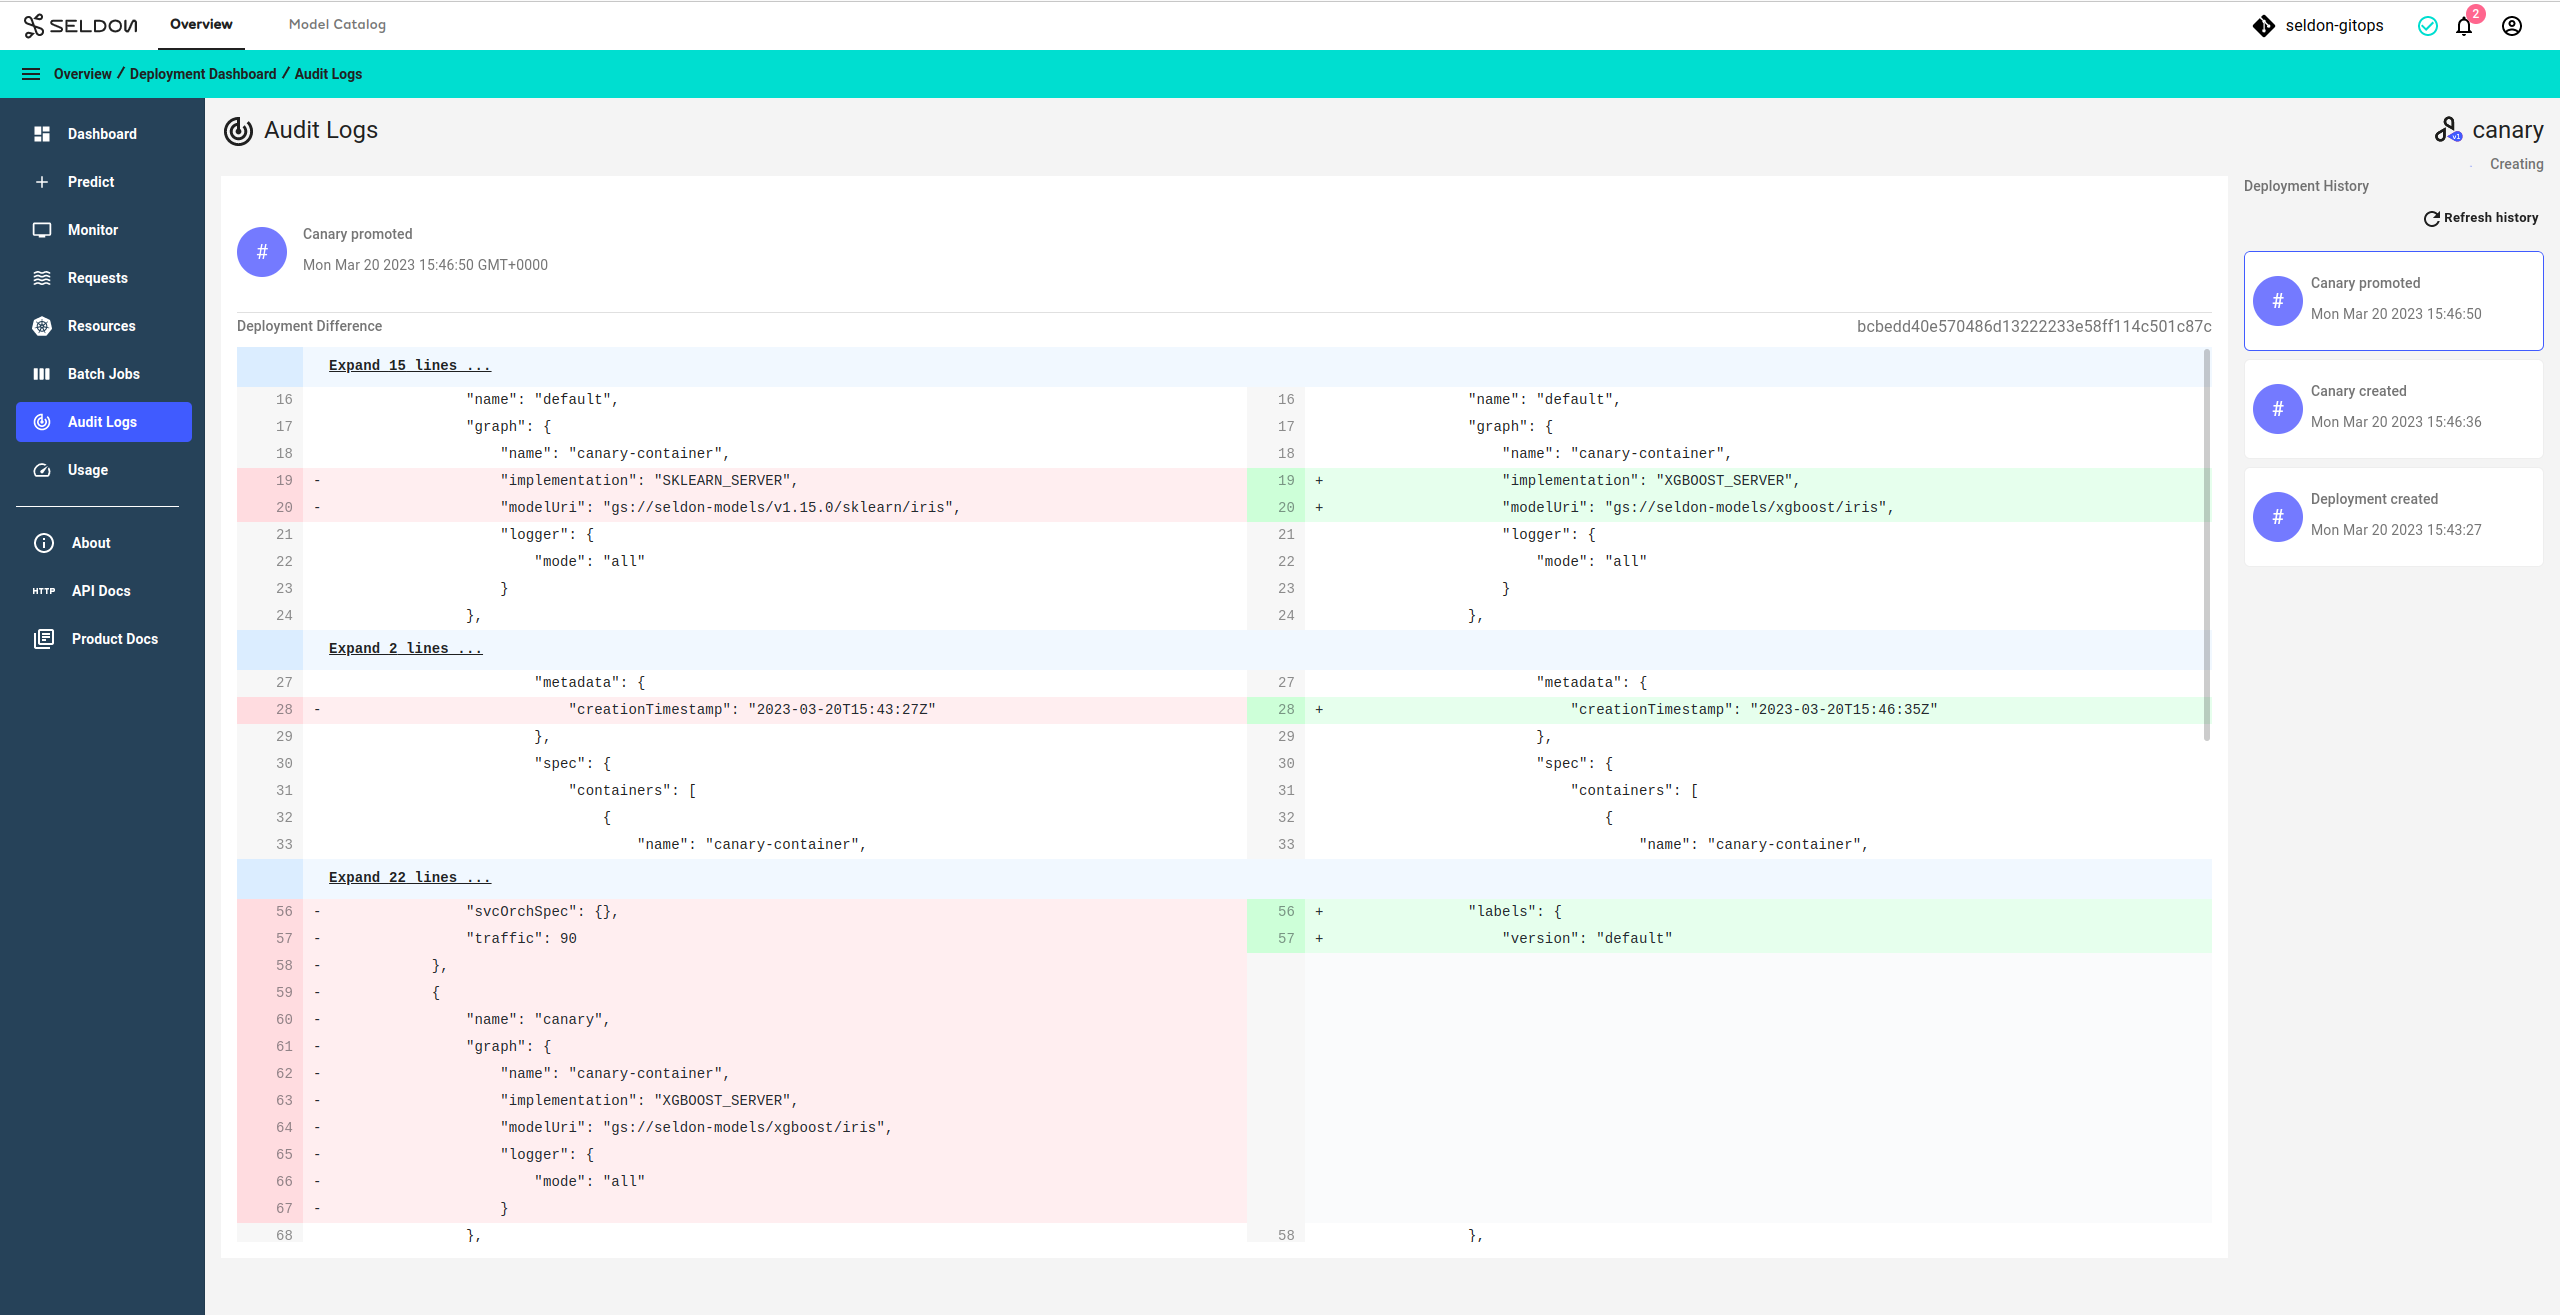
Additionally, for deployments of type Seldon Deployment, you can restore the deployment to a particular state by clicking on the Restore State button.
Note
The Audit Logs page is only available for deployments in GitOps namespaces. The namespace can be changed from the top right drop-down menu whilst viewing the Overview page.
Usage
In the Usage page, you can monitor various metrics such as model, CPU, memory, and container usage.
These metrics and the time range can be selected from the drop-down menu on the right.
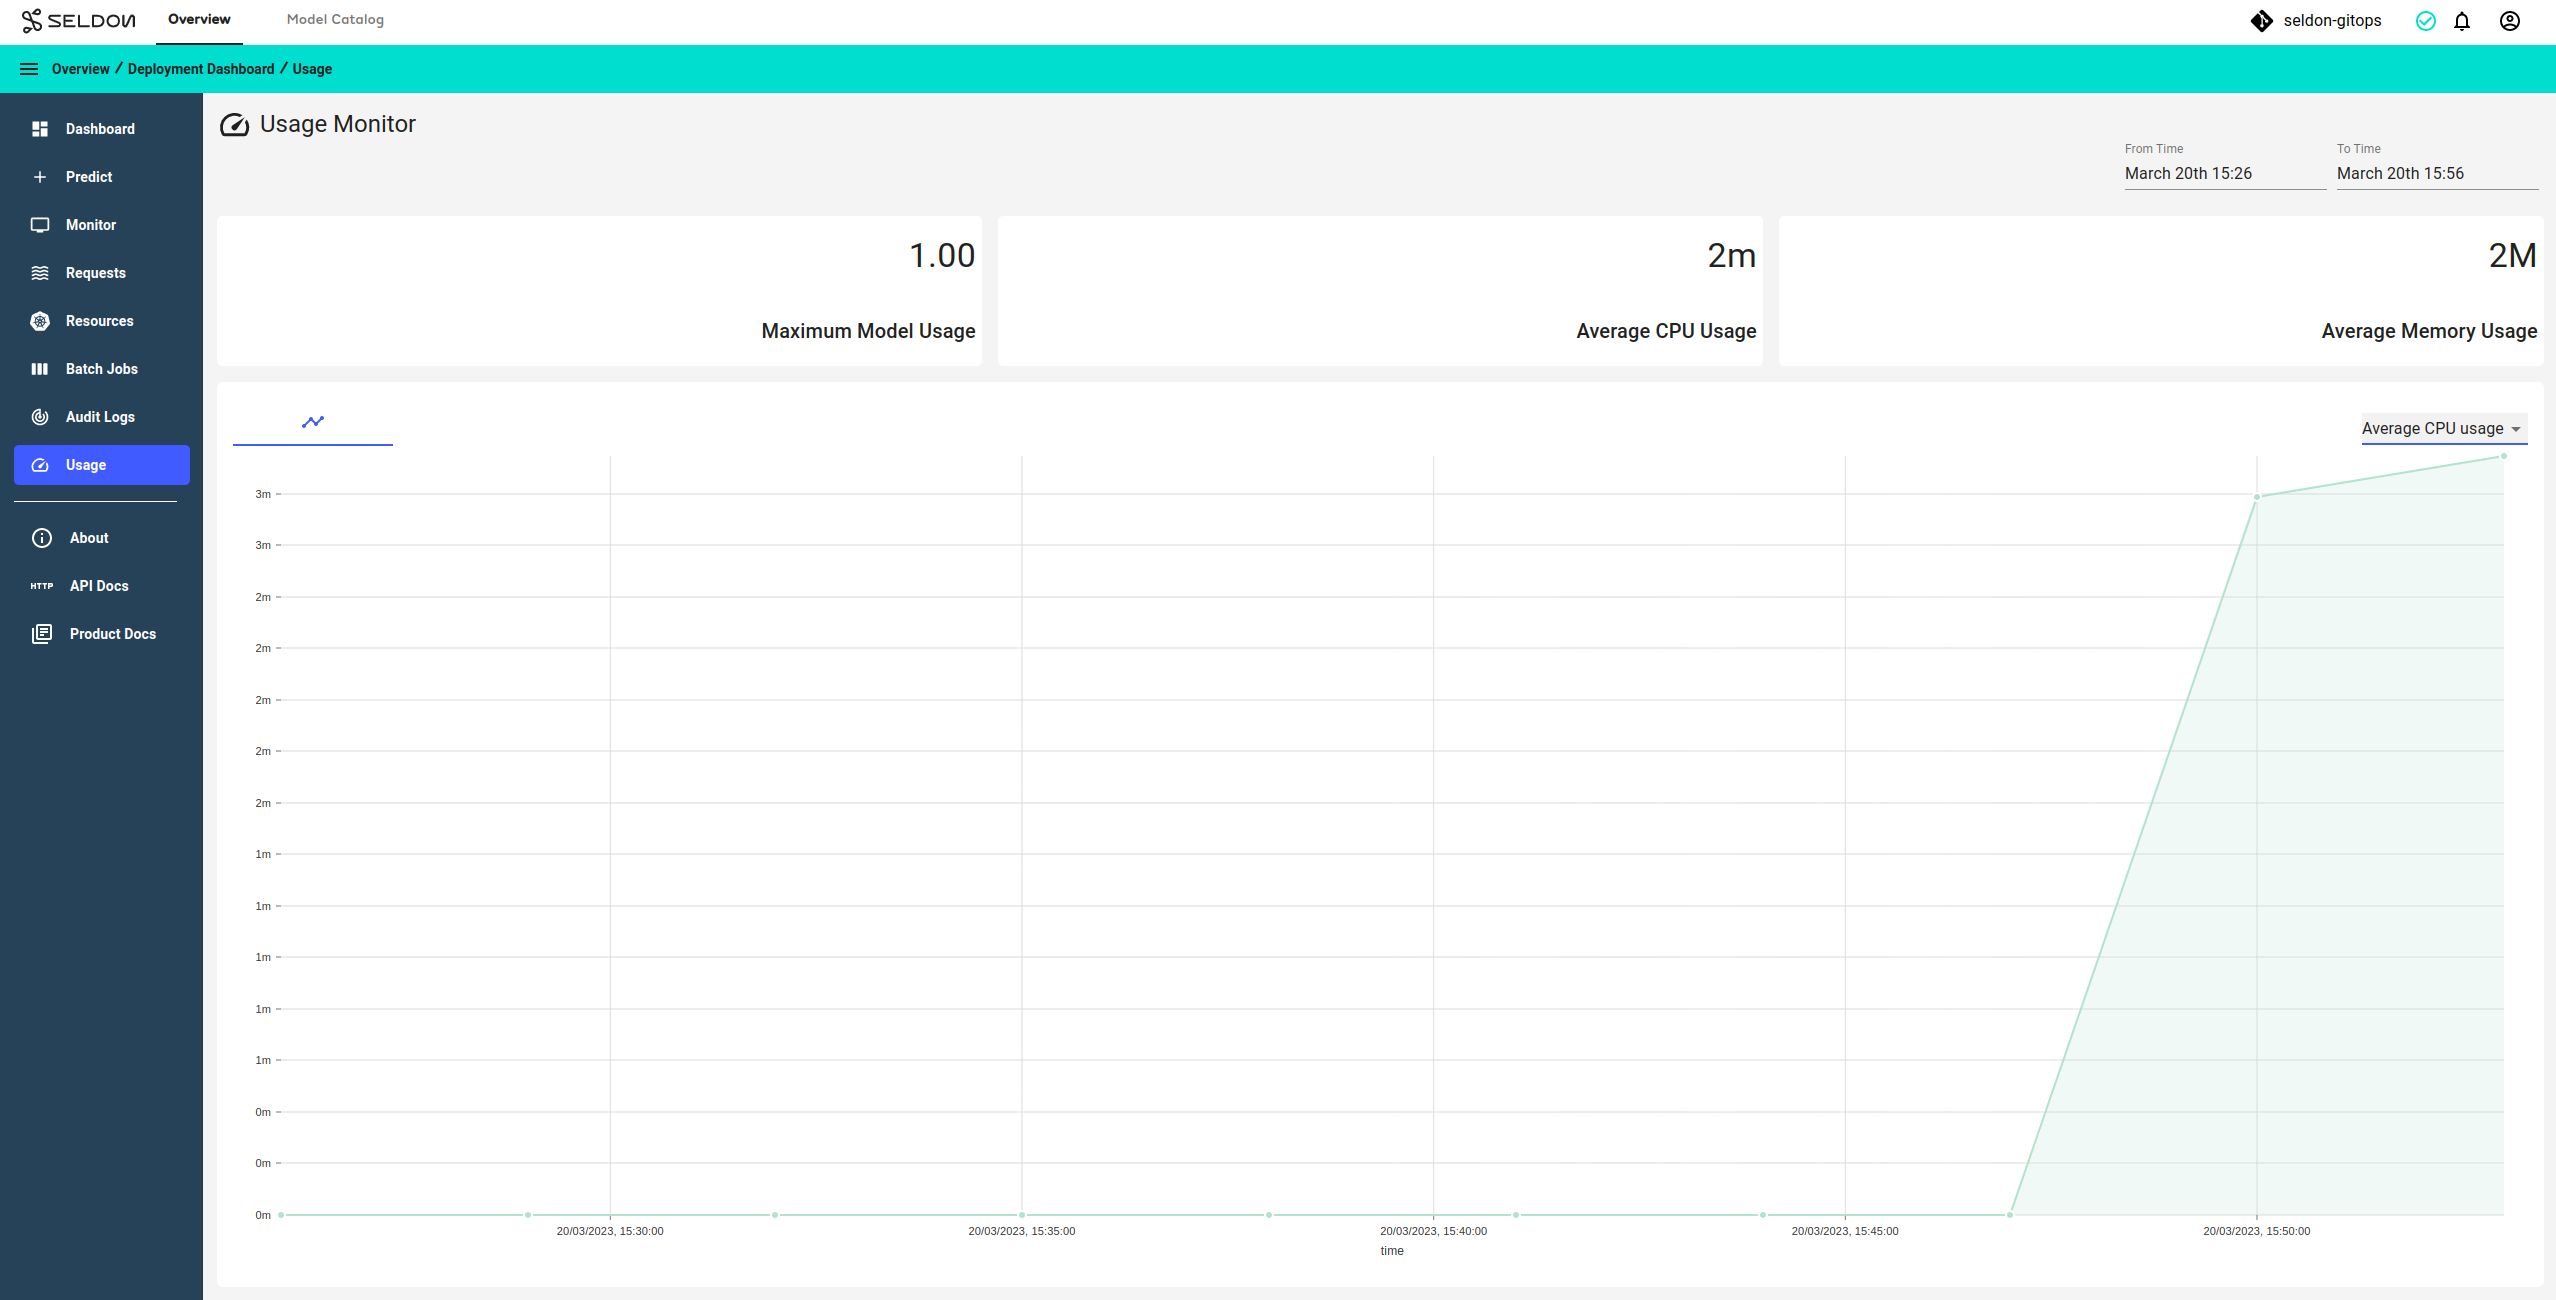
Note
The Usage page is only available for deployments of type Seldon Deployment.