 Seldon Enterprise Platform Documentation Update
Model Drift Detection
When ML models are deployed in production, sometimes even minor changes in a data distribution can adversely affect the performance of ML models. When the input data distribution shifts then prediction quality can drop. It is important to track this drift. This demo is based on the mixed-type tabular data drift detection method in the alibi detect project for tabular datasets.
Here we will :
Launch an income classifier model based on demographic features from a 1996 US census. The data instances contain a person’s characteristics like age, marital status or education while the label represents whether the person makes more or less than $50k per year.
Setup a mixed-type tabular data drift detector for this particular model.
Make a batch of predictions over time.
Track the drift metrics in the Monitoring dashboard.
Important
This demo requires Knative installation on the cluster as the drift detector will be installed as a kservice. See Knative installation instructions for necessary setup required.
Register an income classifier model
Register a pre-trained income classifier SKLearn model with model artefacts stored publicly in this Google bucket: gs://seldon-models/sklearn/income/model-0.23.2
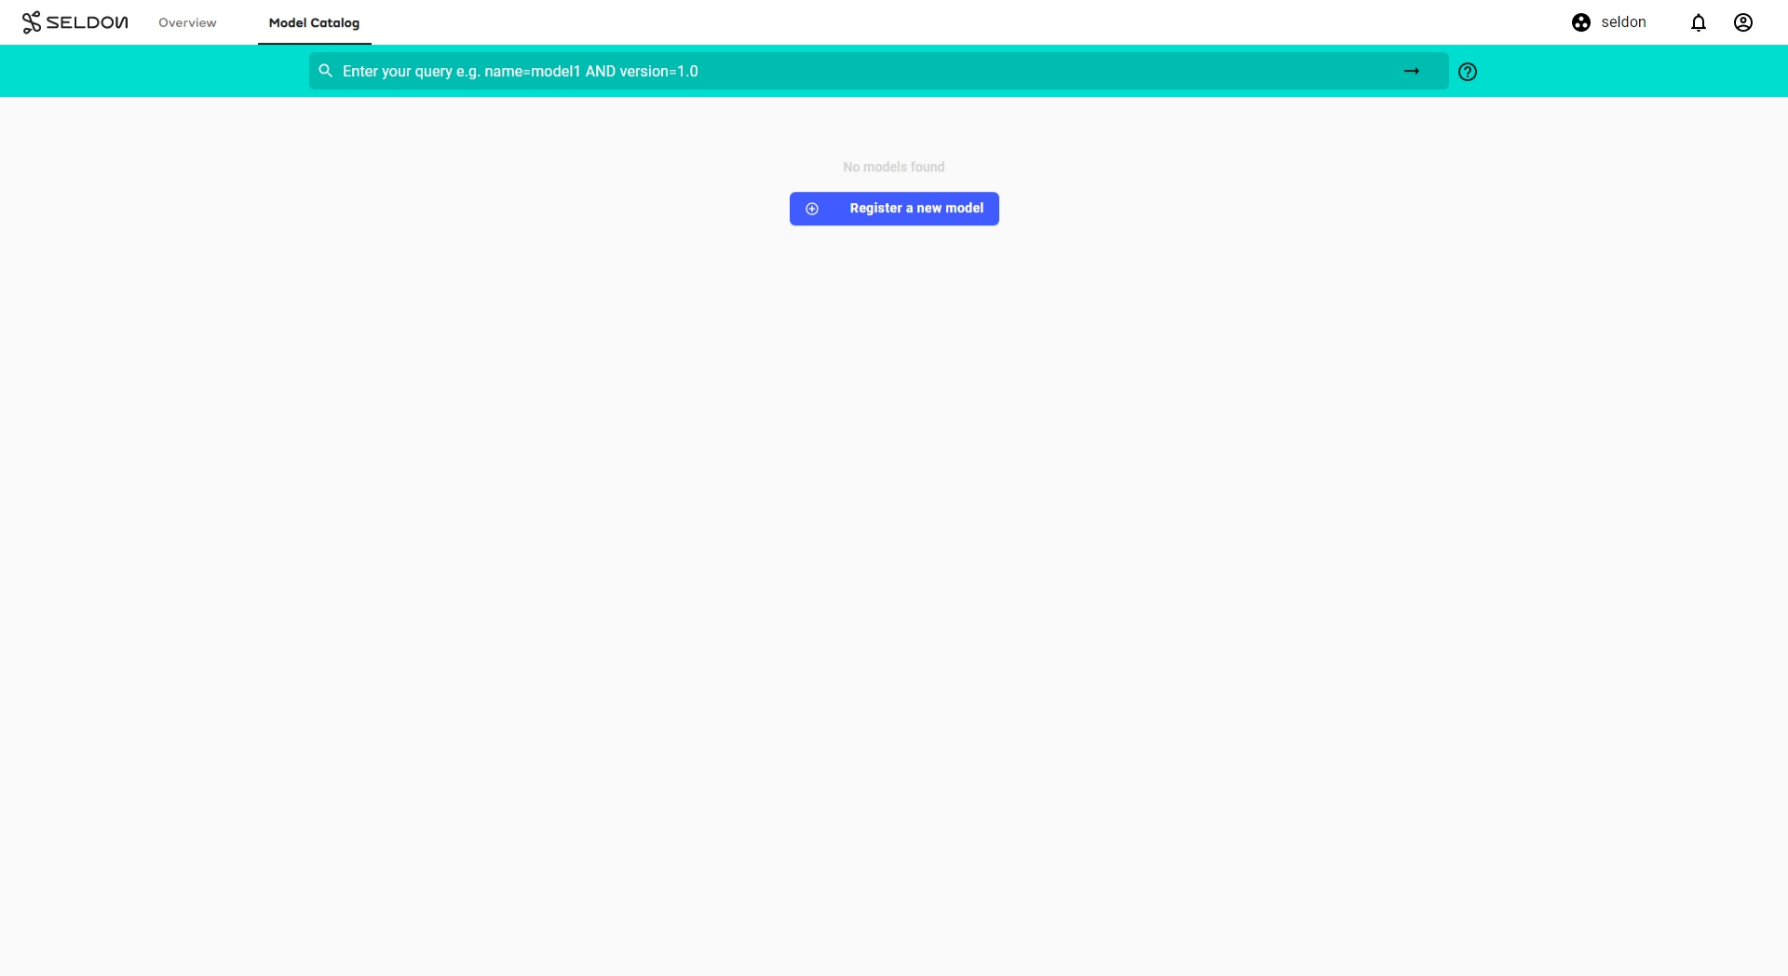
In the
Model Cataloguepage, click theRegister New Modelbutton:Expand to see the 'Register New Model' button
In the
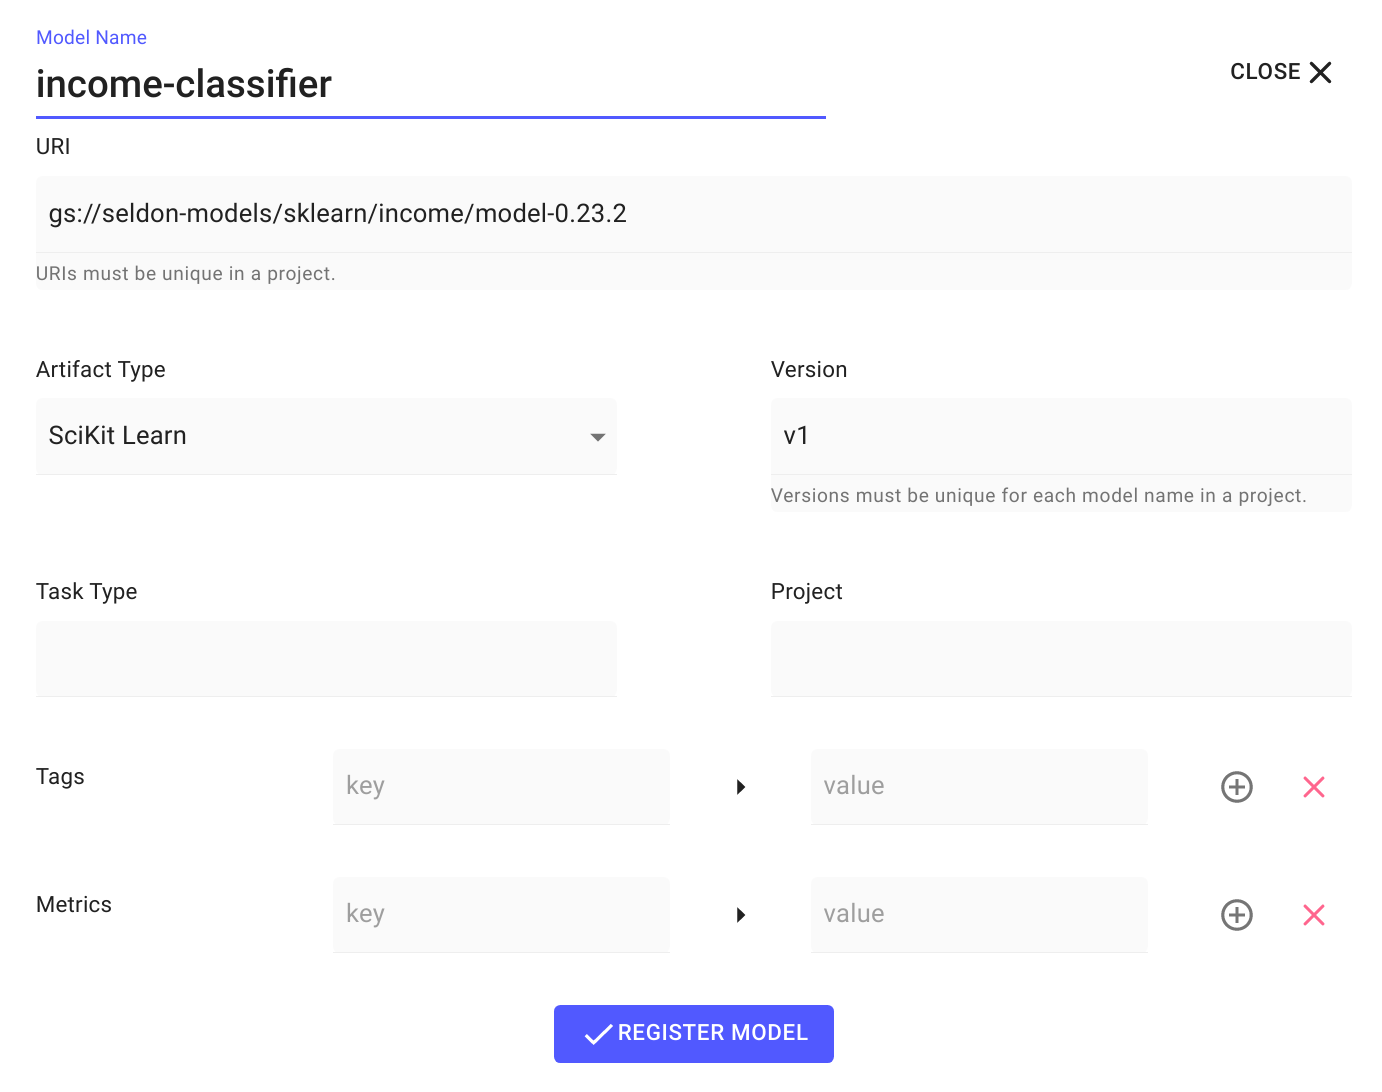
Register New Modelwizard, enter the following information, then clickREGISTER MODEL:Model Name:
income-classifierURI:
gs://seldon-models/sklearn/income/model-0.23.2Artifact Type:
SciKit LearnVersion:
v1
Expand to see model configuration
Configure predictions schema
Edit the model metadata to update the prediction schema for the model. The prediction schema is a generic schema structure for machine learning model predictions. It is a definition of feature inputs and output targets from the model prediction. Use the income classifier model predictions schema to edit and save the model level metadata. Learn more about the predictions schema at the ML Predictions Schema open source repository.
Click on the
income-classifiermodel that you have just registered.Click the
Edit Metadatabutton to update the prediction schema associated with the model.Paste the
prediction schemaand clickSave Metadata.
Launch a Seldon Core V1 Deployment
Deploy the income classifier model from the catalogue into an appropriate namespace
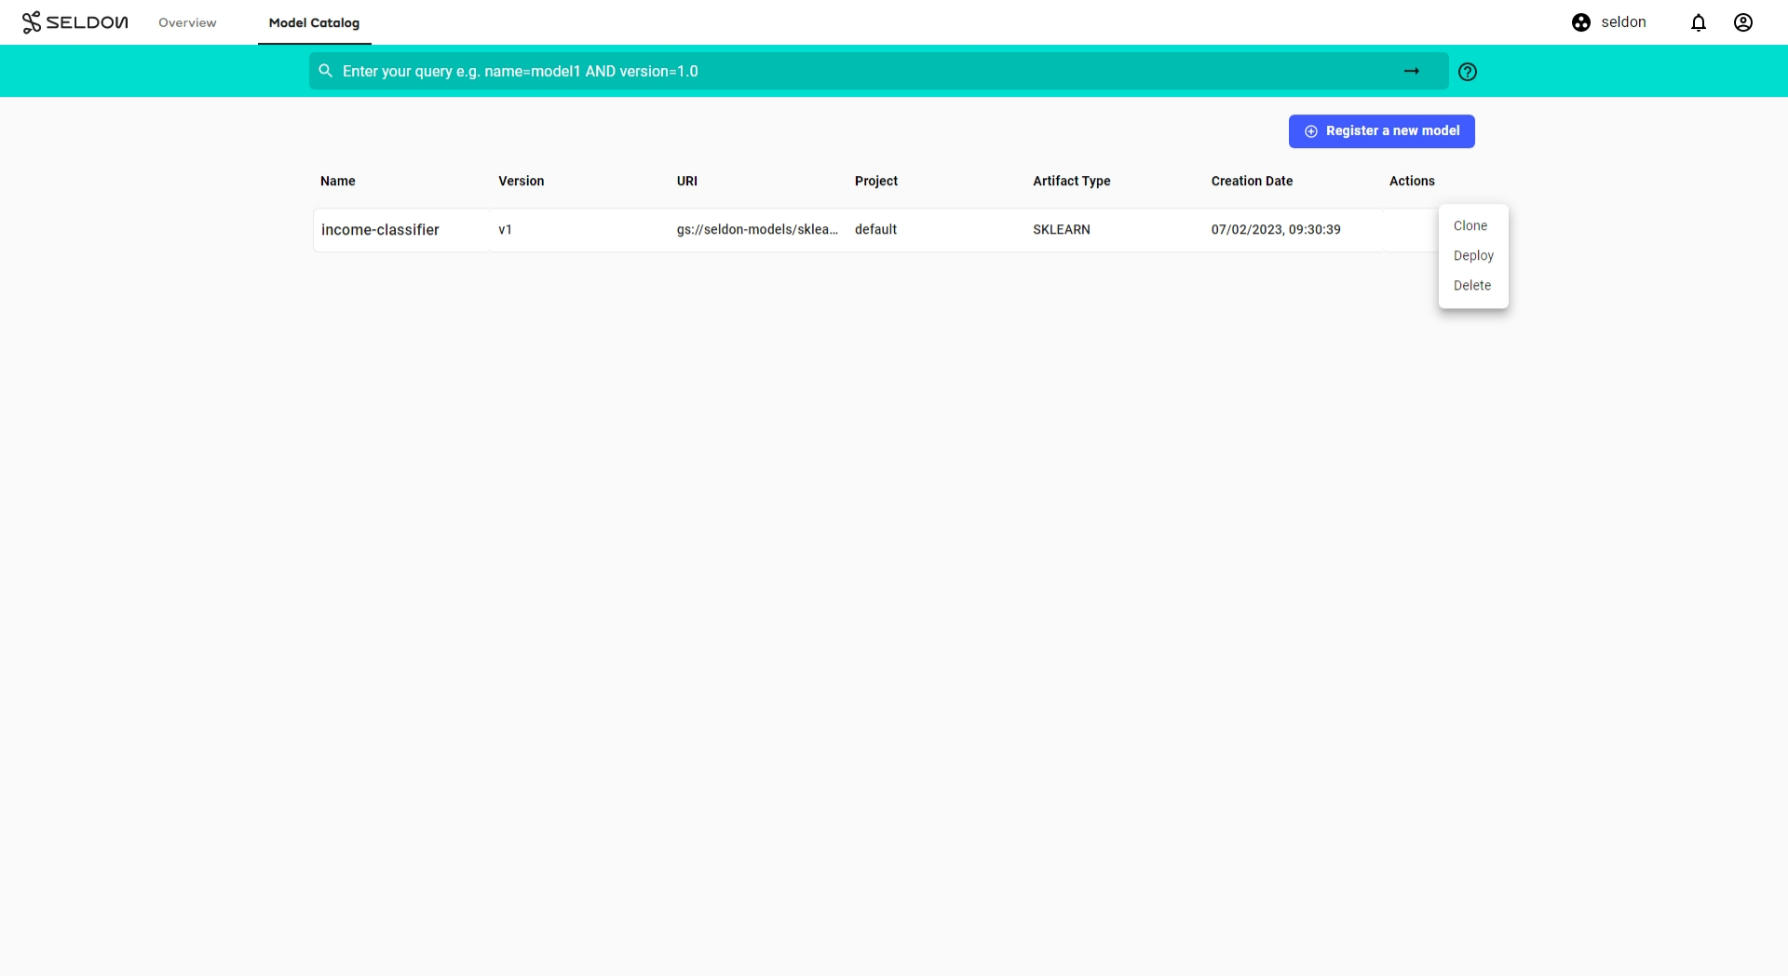
From the model catalogue, under the
Actiondropdown list, selectDeploy.Expand to see deploy model
Enter the deployment details in the deployment creation wizard and click
Next:Name:
income-classifierType:
Seldon DeploymentProtocol:
Seldon
Expand to see deploy model
In the deployment creation wizard, enter a name for your new deployment (e.g.
income-classifier). Select the namespace you would like the deployment to reside in (e.g.seldon). From the protocol dropdown menu, selectSeldonand click Next.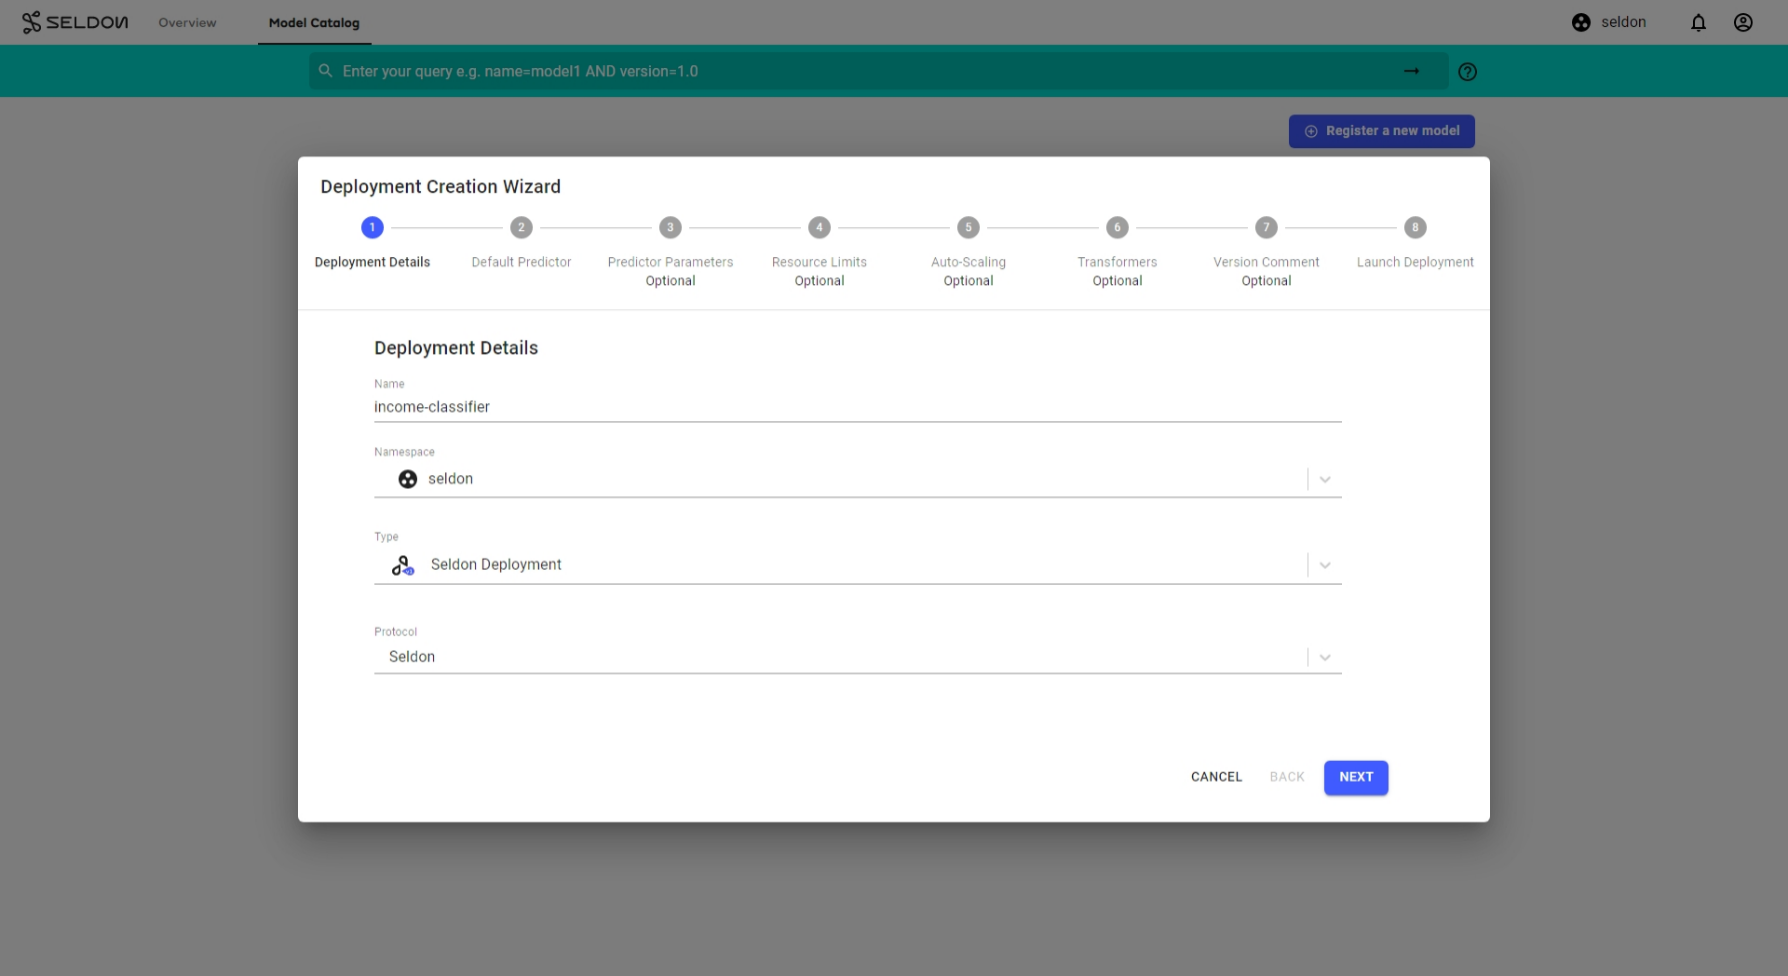
The predictor details should already be filled in from the model catalogue. Click
Next:Expand to see default predictor details
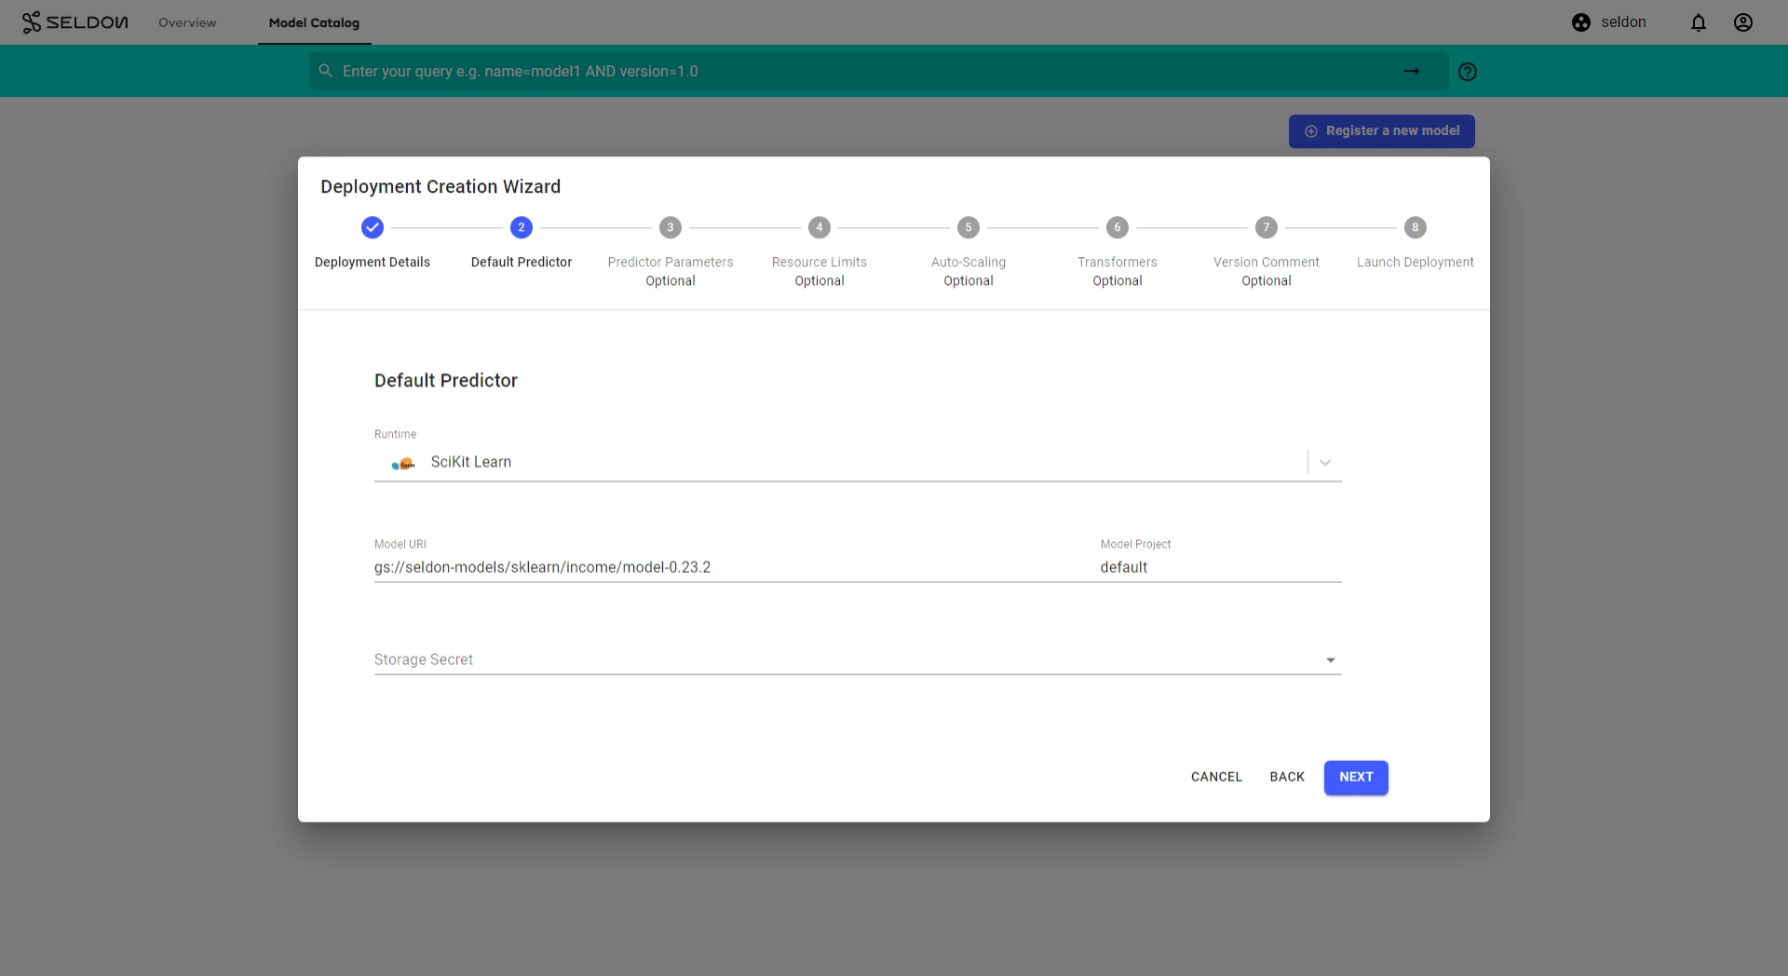
Click
Nextfor the remaining steps, then clickLaunch.
Add A Drift Detector
From the deployment overview page, select your deployment to enter the deployment dashboard. Inside the deployment dashboard, add a drift detector with by clicking the Add button within the Drift Detection widget.
Expand to see drift detector creation
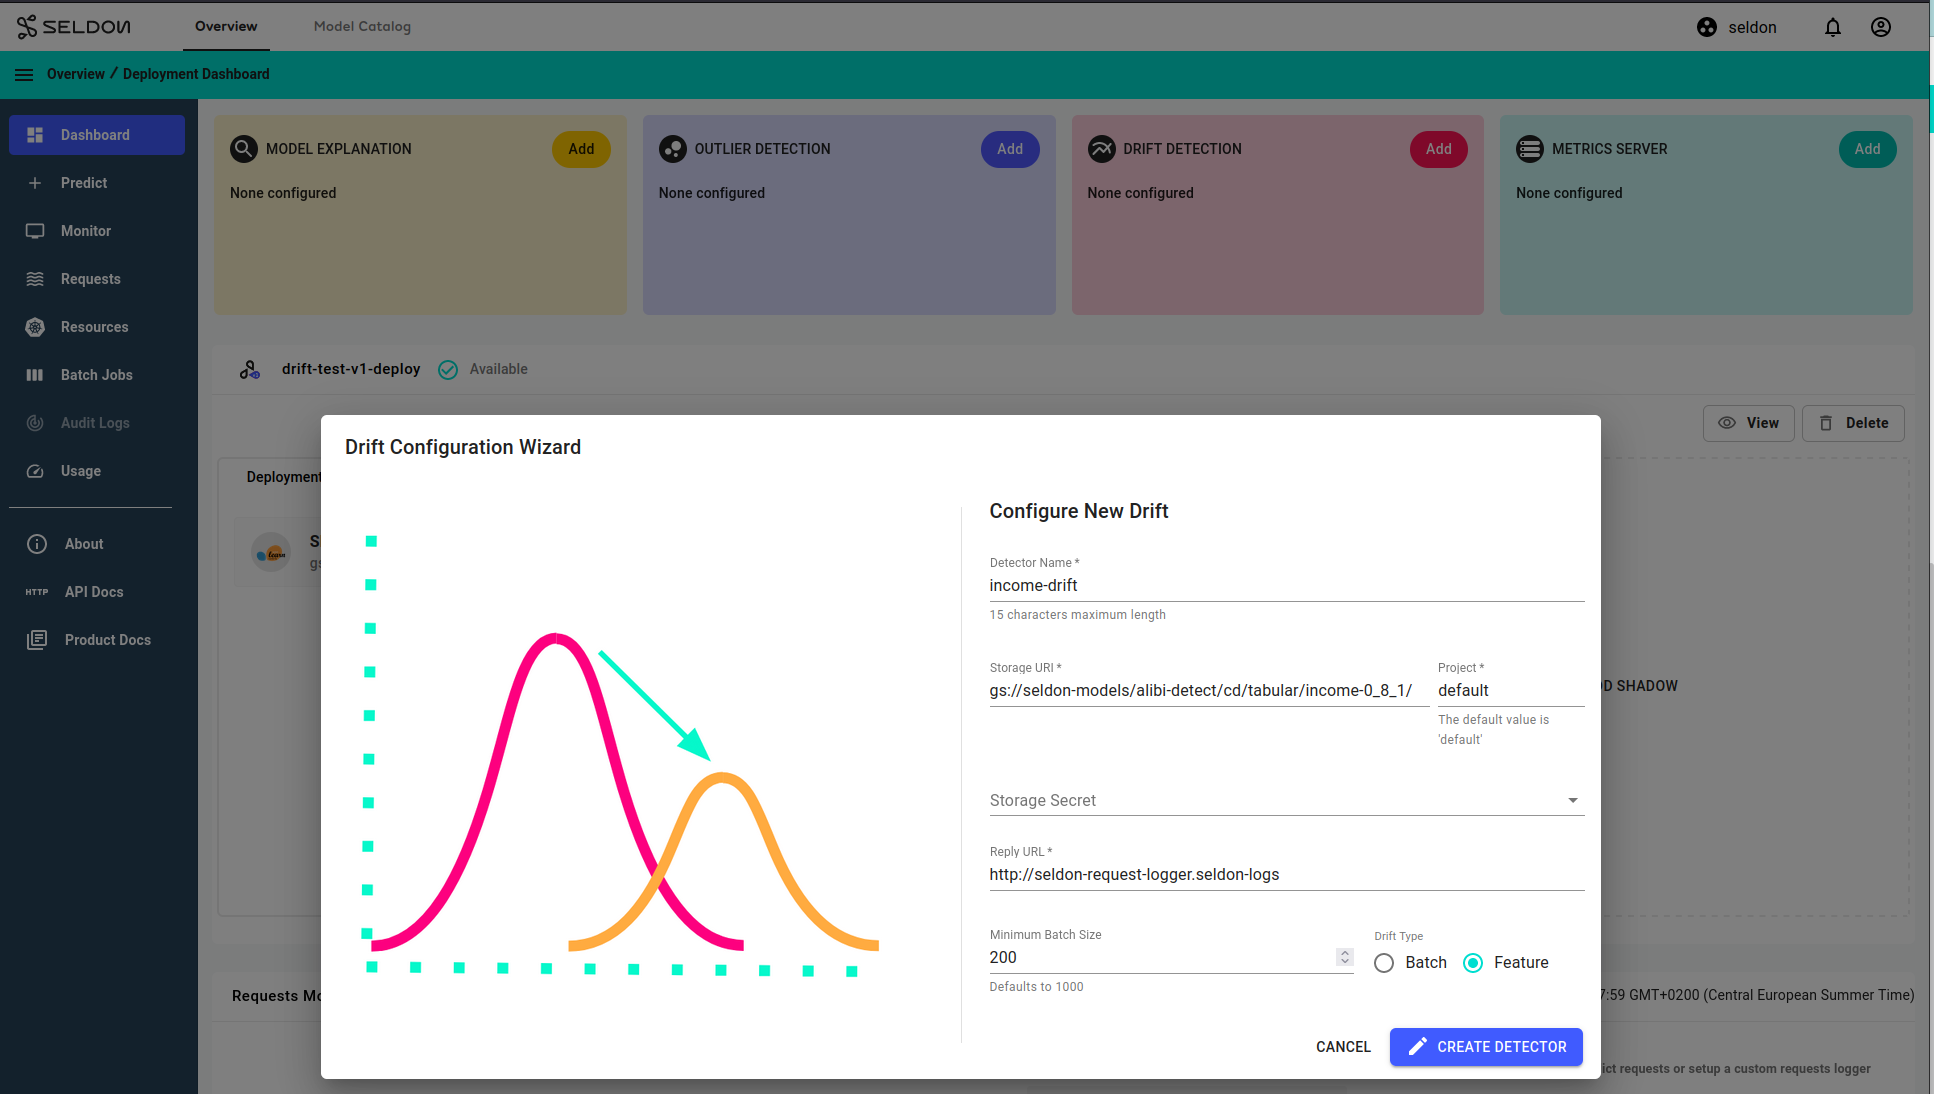
Enter the following parameters in the modal popup which appears, to configure the detector:
Model Name:
income-drift.Storage URI: (For public Google Buckets, secret field is optional)
gs://seldon-models/alibi-detect/cd/tabular/income-0_8_1/
Reply URL: Leave as the default value, shown below, unless you are using a custom installation, please change this parameter according to your installation
http://seldon-request-logger.seldon-logs
Minimum Batch Size:
200Drift Type:
Feature
Then, click CREATE DETECTOR to complete the setup.
The drift detector model used here was trained similarly to the mixed type data drift detection model in the alibi-detect documentation, with one key difference - the reference dataset used was a filtered for working-class adults where only entries with Age > 30 (more than 30) and Hours per Week > 40 (more than 40) were kept from the data set as reference.
Run Batch Predictions
From the deployment dashboard, click on
Batch Jobs. Run a batch prediction job using the ndarray payload format textpredictions data file. This file has 4000 individual data points and based on our drift detector configuration, drift will be detected for a batch every200points. The distribution of the data in the first half section is the same as the distribution of the reference data the drift detector was configured with and the second half section of the data should be different to observe drift.Upload the data to a bucket store of your choice. This demo will use MinIO and store the data at bucket path
minio://income-batch-data/data.txt. Do not forget to configure your storage access credentials secret - we have it asminio-bucket-envvarshere. Refer to the batch request demo for an example of how this can be done via the minio browser.Running a batch job with the configuration below. This runs an offline job that makes a prediction request for a batch of 200 rows in the file at
minio://income-batch-data/data.txtevery5 seconds:Input Data Location: minio://income-batch-data/data.txt Output Data Location: minio://income-batch-data/output-{{workflow.name}}.txt Number of Workers: 1 Number of Retries: 3 Batch Size: 200 Minimum Batch Wait Interval (sec): 5 Method: Predict Transport Protocol: REST Input Data Type: ndarray Object Store Secret Name: minio-bucket-envvars
Monitor Drift Detection Metrics
Under the Monitor section of your deployment navigation, on the Drift Detection Tab, you can see a timeline of drift detection metrics.
As mentioned above, the drift detection model was trained with data for working-class adults where only entries with Age > 30 (more than 30) and Hours per Week > 40 (more than 40) were kept from the data set as reference. The live prediction data set provided for the batch prediction jobs contains entries with Age > 30 and Hours per Week > 40 in the first 2000 rows referring to working class adults, and later entries with Age < 20 (less than 20) and Hours per Week < 20 (less than 20) in the last 2000 rows referring to teen aged part-time workers/students.
The drift dashboard showcases 2 types of metrics graphs:
P-value score over time
1a. Zoomed in view, focusing on features that have drifted, i.e. features that have a p-value score of less than the threshold.
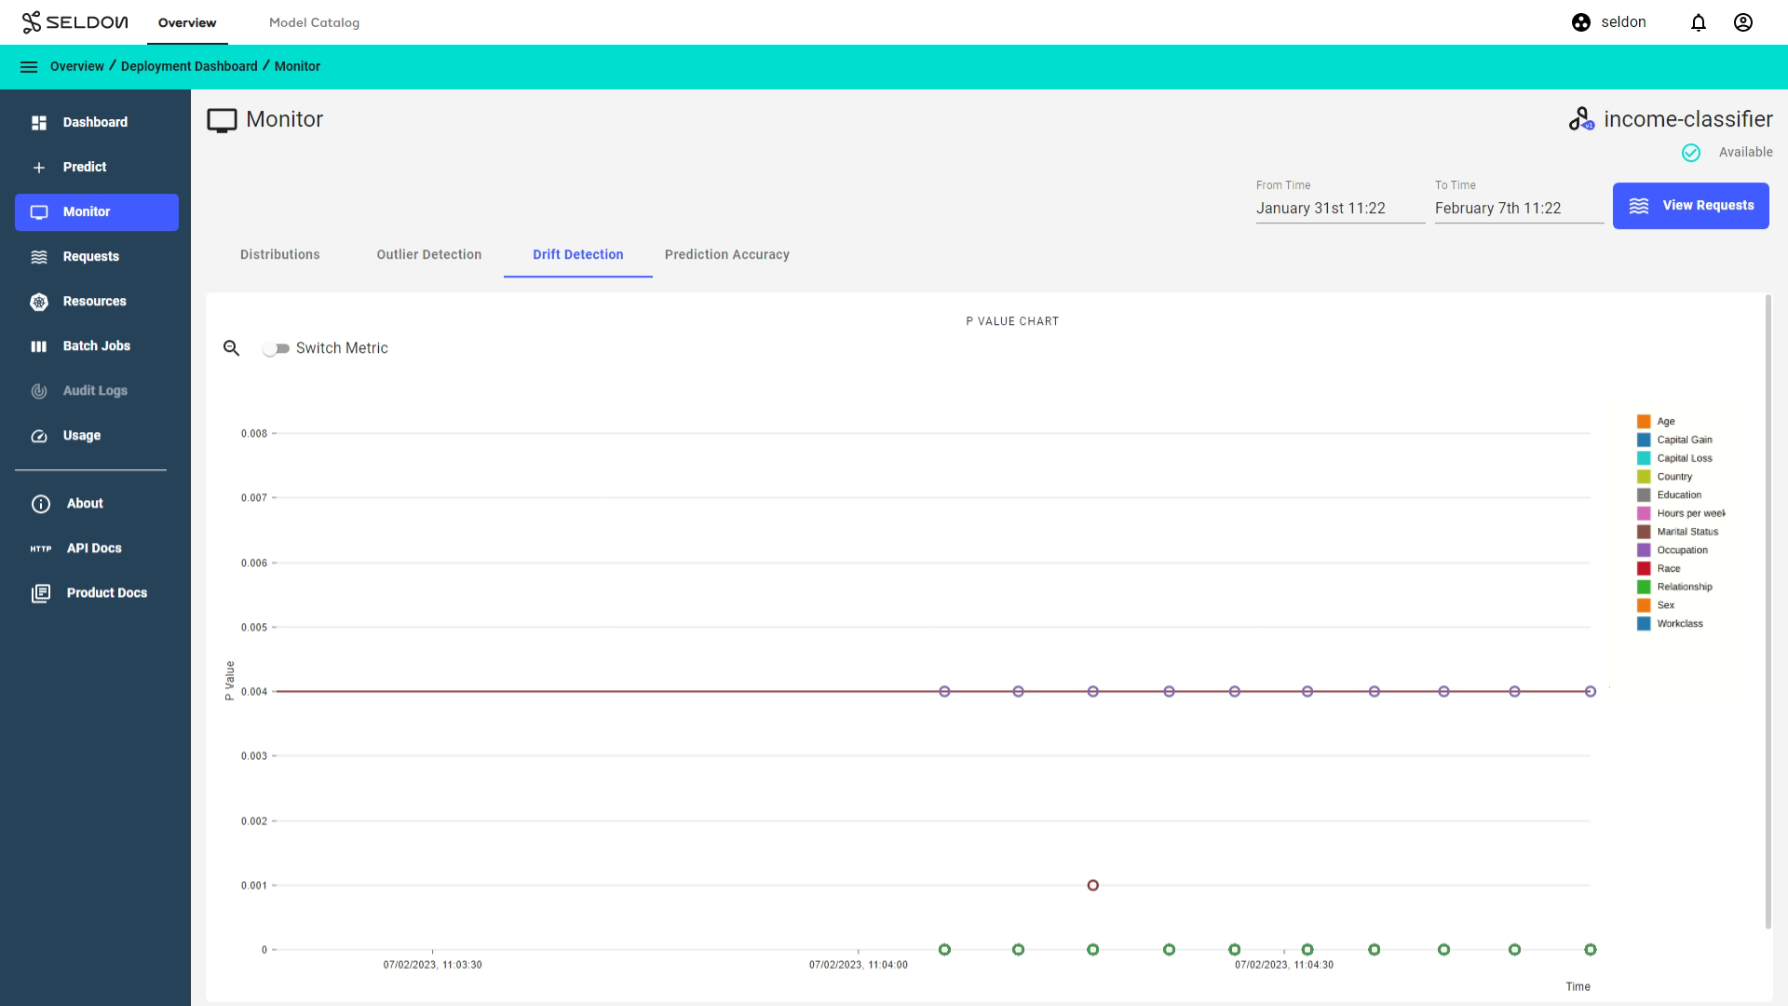
2b. Zoomed out view, showing all features.
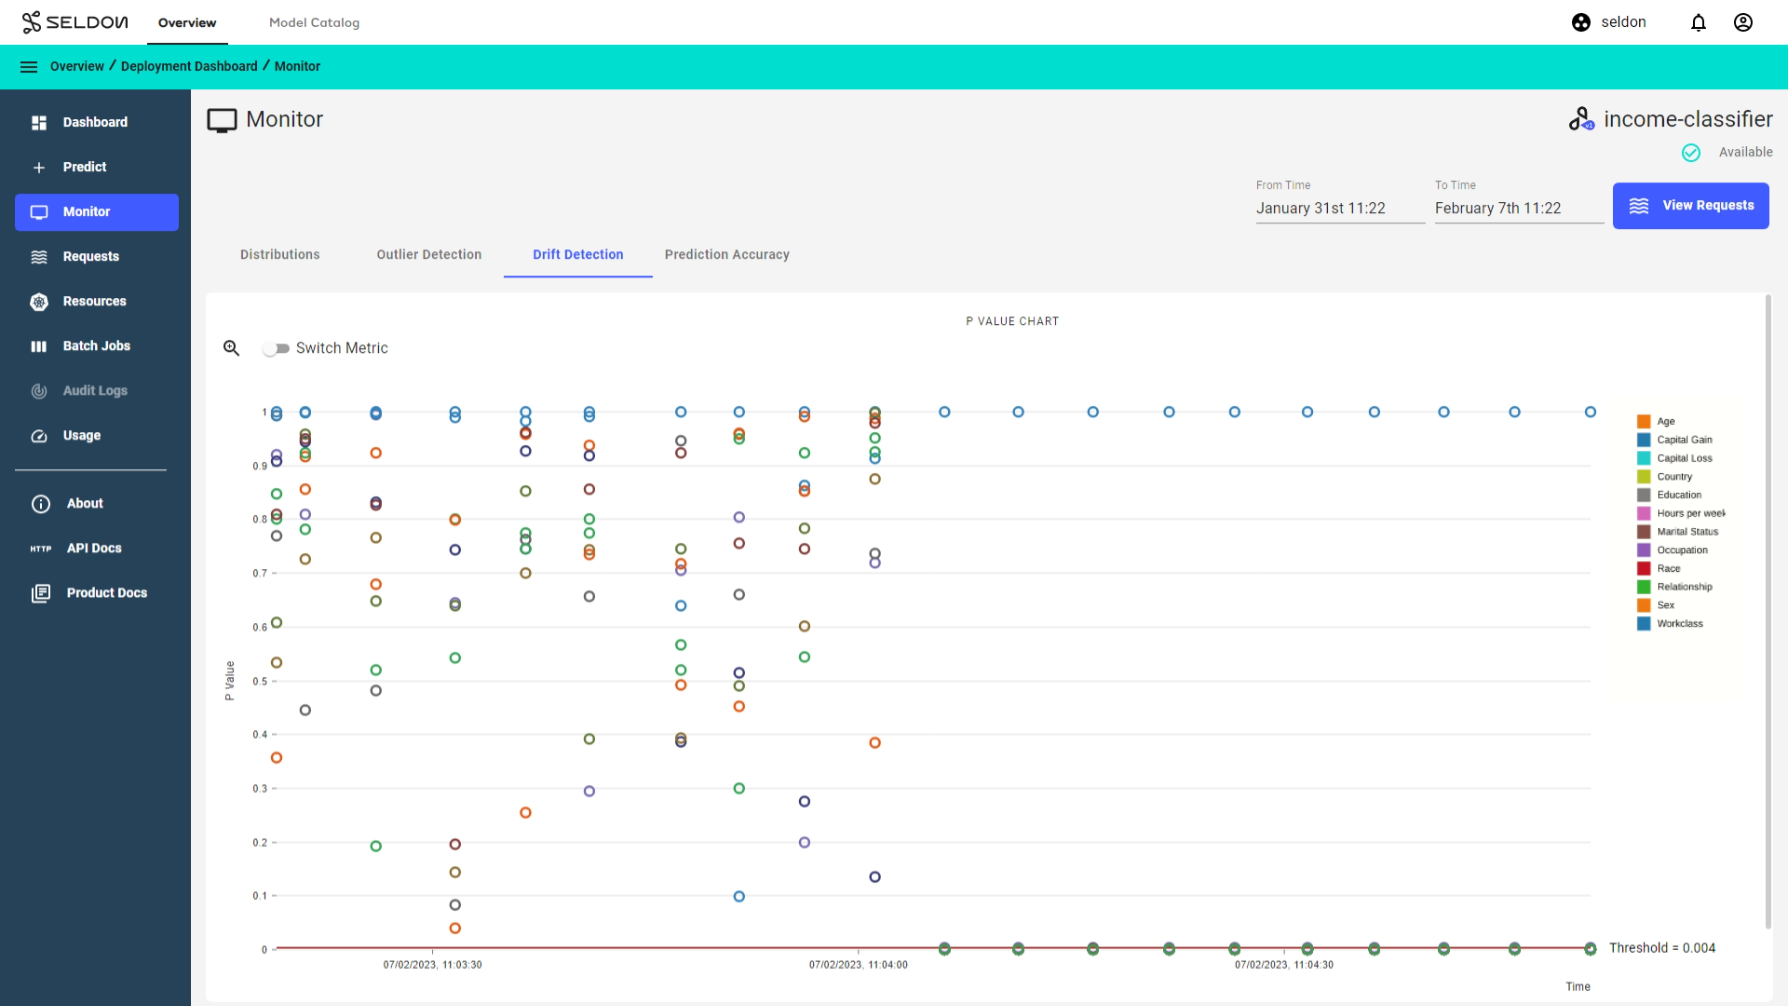
Distance score over time.
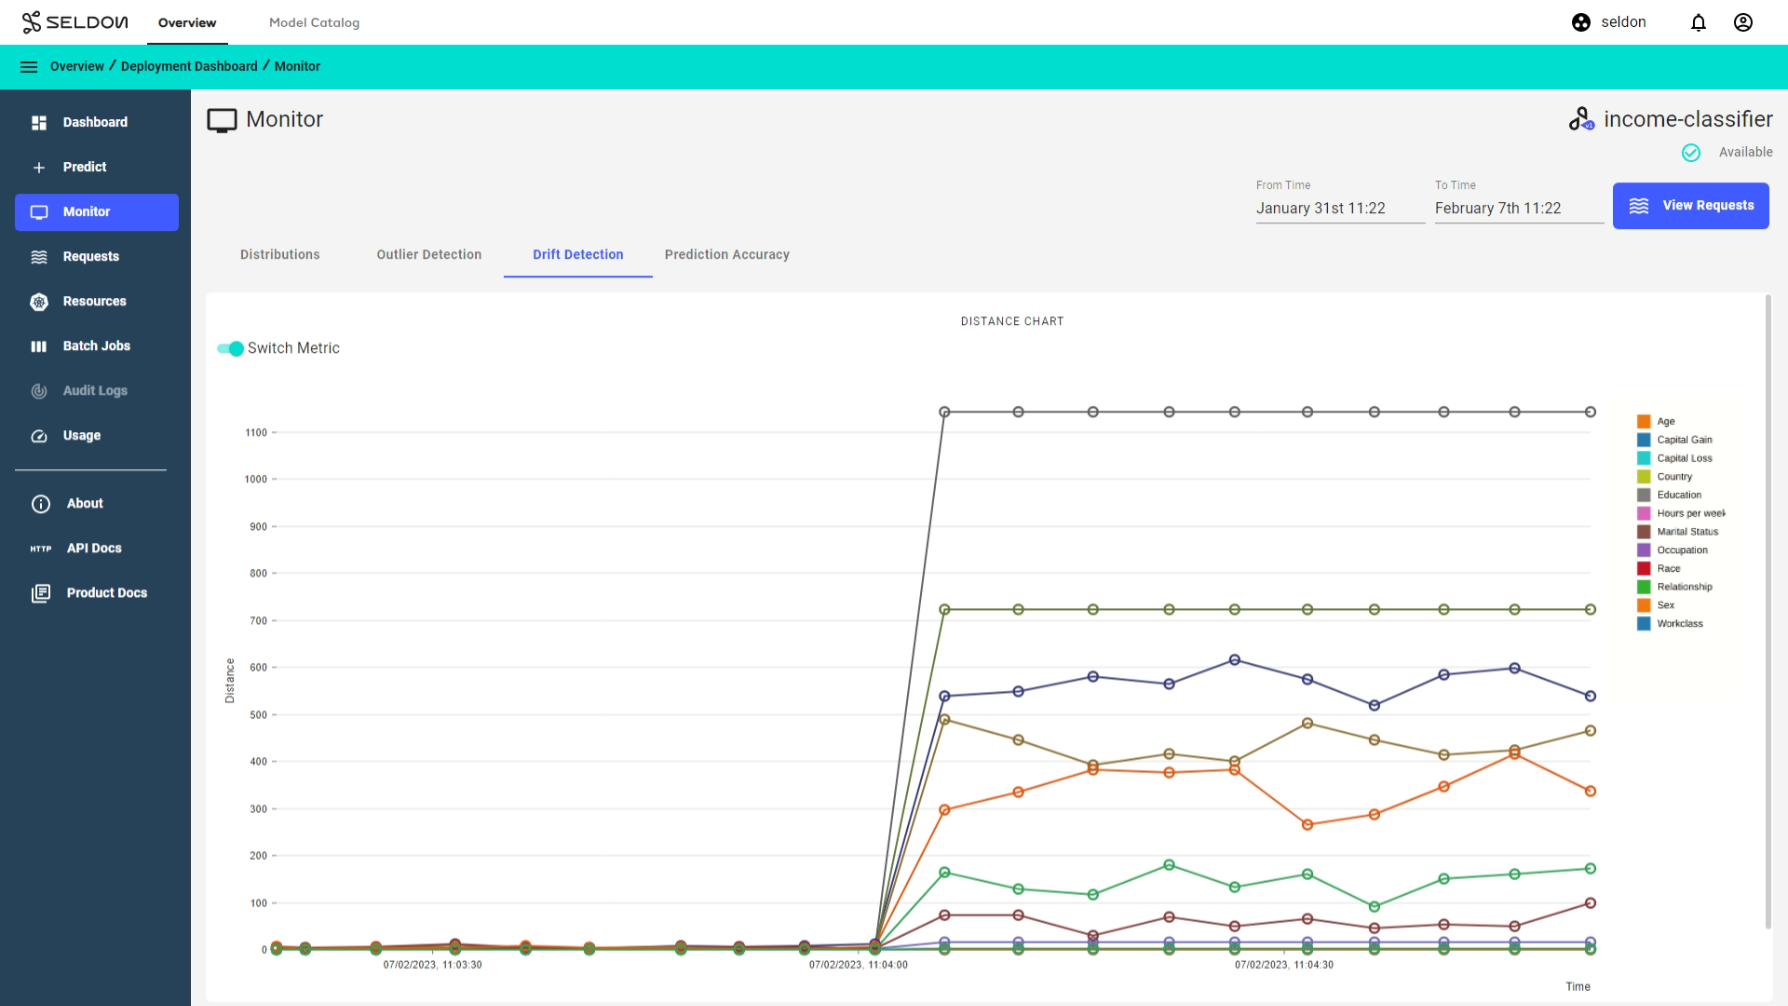
Note that for both drift metrics graphs, the starting batches do not drift and are marked by an empty O symbol, while the later batches do drift and are marked by a filled O symbol.
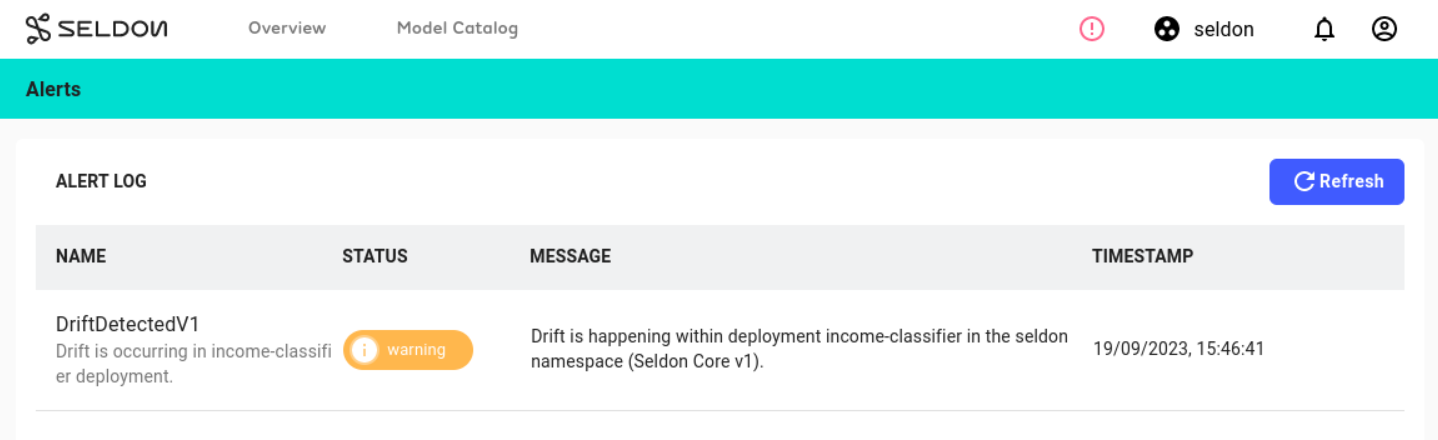
Monitor Drift Detection Alerts
If you have alerting configured you should see a notification about the drift
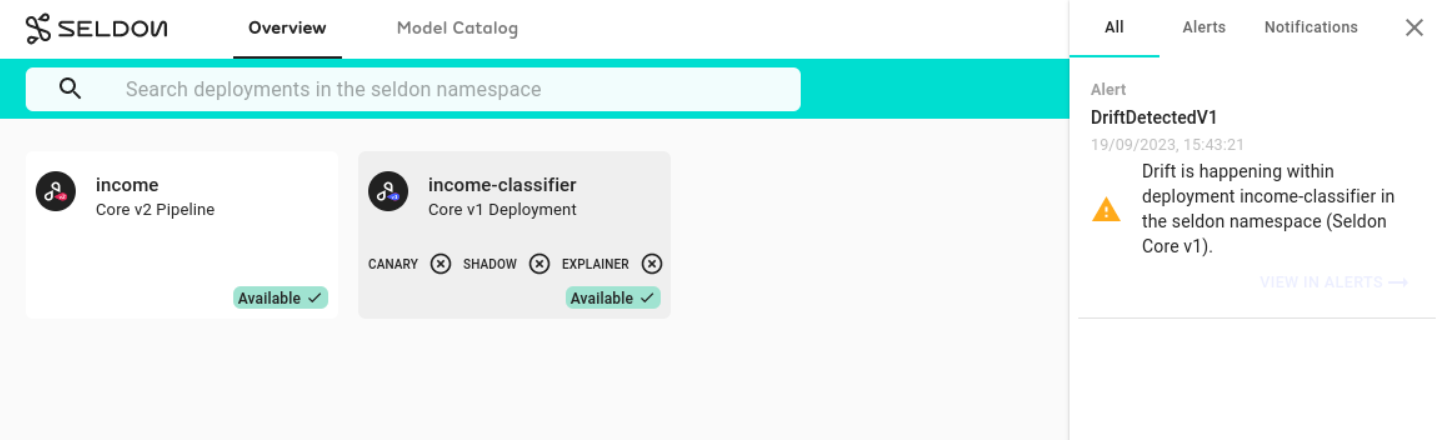
with further details present on the alerting log
Data drift and reference distributions comparison
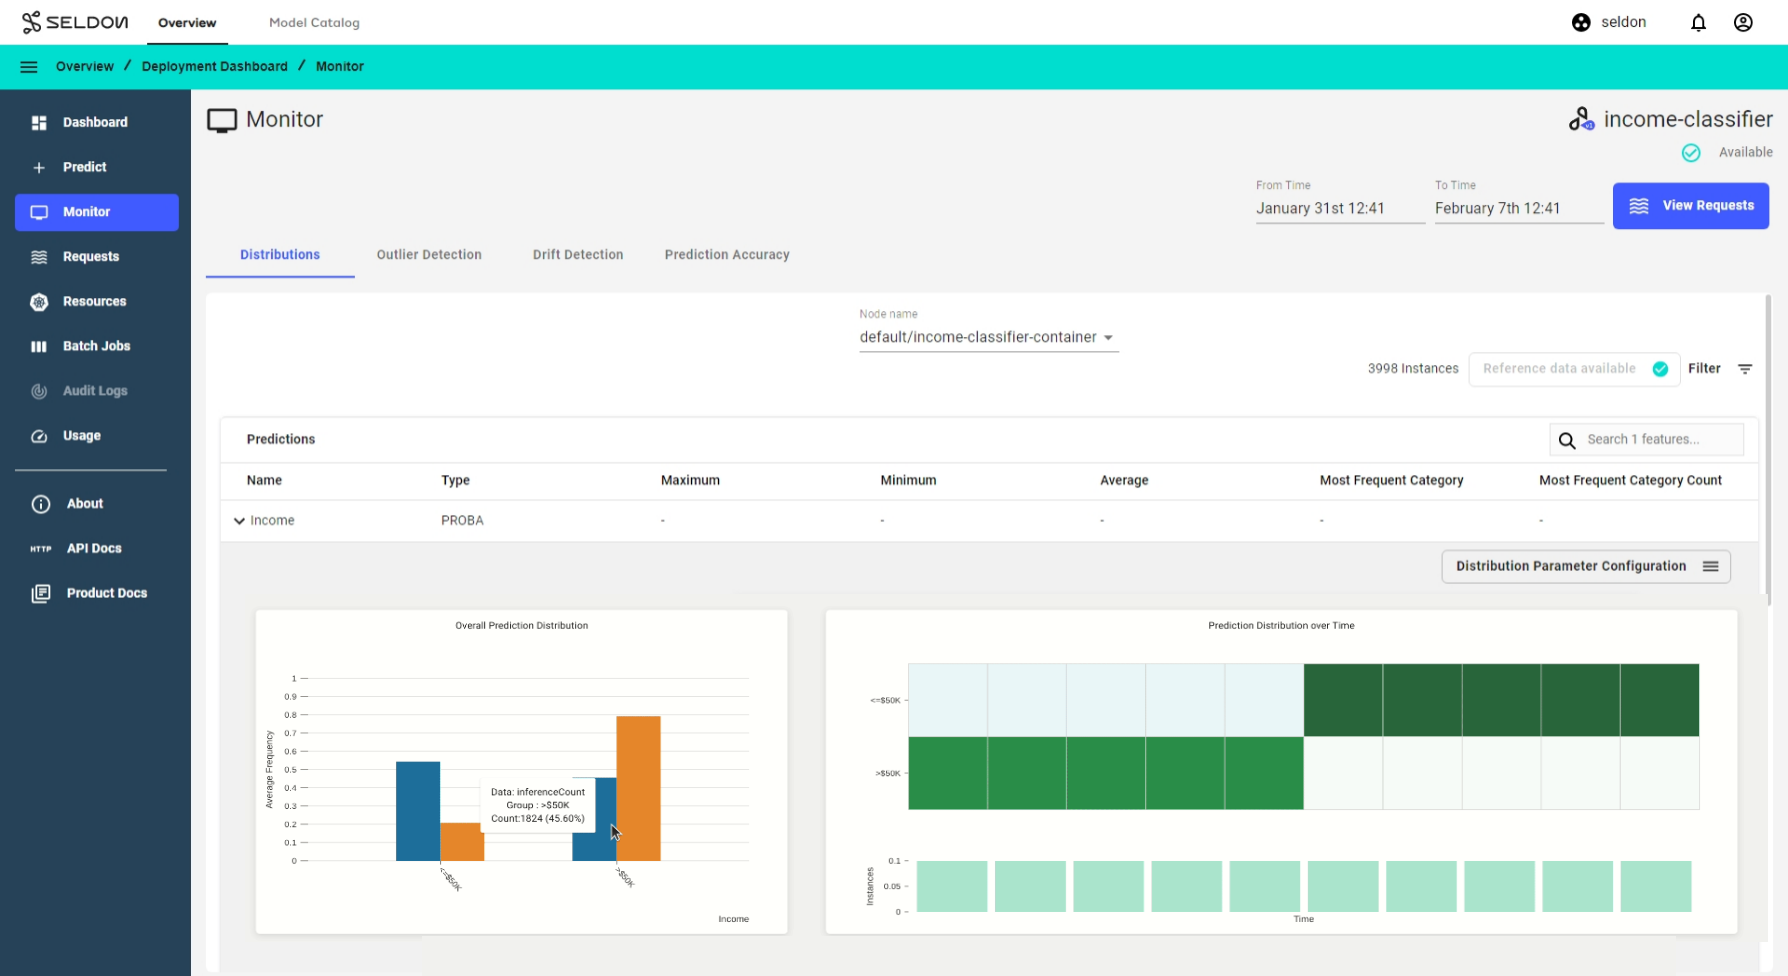
To further analyse prediction data drift, you can also switch to the feature distribution tab to compare predictions to reference data distribution. See feature distribution monitoring demo for setup details.
Upload the income classifier reference dataset as the reference data to monitor data drift in terms of feature distributions. Once reference data is available, you can compare the distributions of the prediction data to the reference data.
Expand to see reference data available
You can see when reference data is available by checking the button on the top left of the DISTRIBUTIONS dashboard. If it is not clickable and displays REFERENCE DATA AVAILABLE, then reference data is available.
When switching to the DISTRIBUTIONS dashboard, you may also see the following notification pop up:

Troubleshooting
If you experience issues with this demo, see the troubleshooting docs and also the Knative or Elasticsearch sections.