 Seldon Enterprise Platform Documentation Update
Model Accuracy Metrics
Iris is the genus of flower which contains 3 species: setosa, versicolor, and virginica. This demo is based on iris classification model based on flower properties like sepal length, sepal width, petal length, and petal width. The species are also the classes that will be used for the classification. Here we will:
Launch an iris classifier model
Set up a metrics server for this particular model
Send a request to get an iris classification
Send feedback requests to gather accuracy metrics
Important
This demo requires Knative installation on the cluster as the metrics server will be installed as a kservice. Also, the metrics server only works with classification models in this version.
Create Model
Deploy the iris classifier model from the catalogue into an appropriate namespace
From the
Deploymentspage, select theCreate new deploymentbutton in the top right corner:Expand to see deploy model
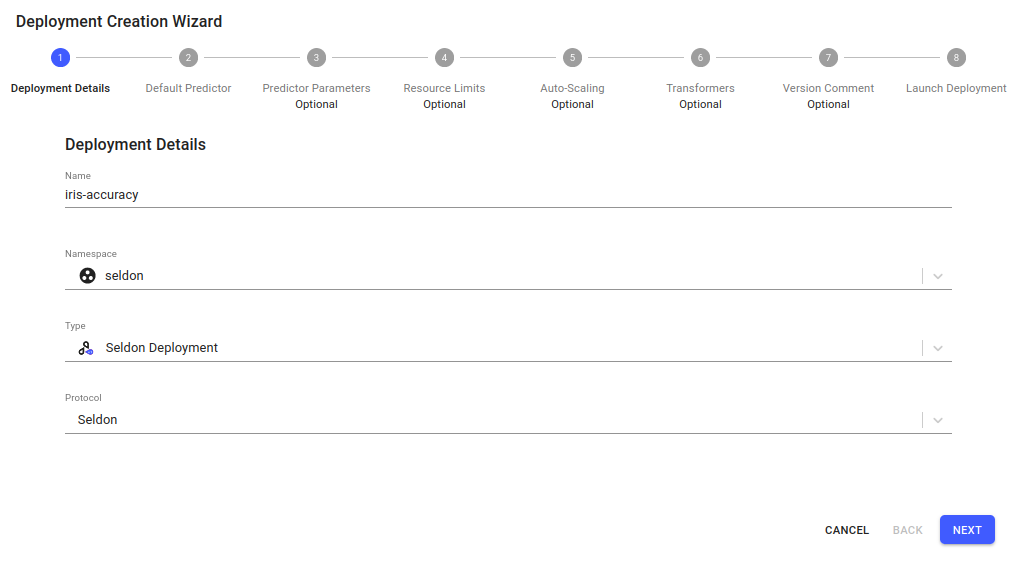
Enter the deployment details in the deployment creation wizard and click
Next:Name:
iris-accuracyType:
Seldon DeploymentProtocol:
Seldon
Expand to see deploy model
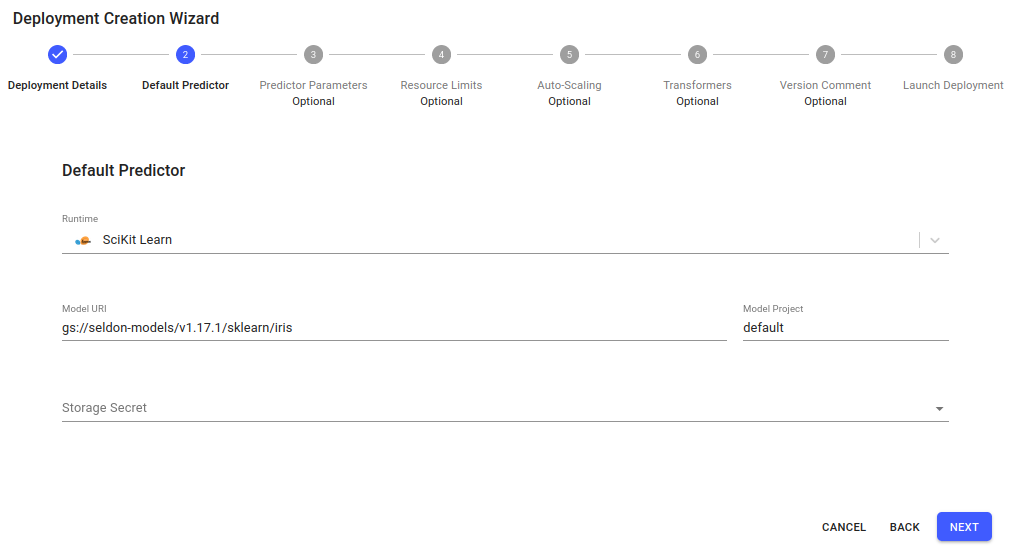
Fill in details about the default predictor:
Runtime:
SciKit LearnModel URI:
gs://seldon-models/v1.18.1/sklearn/iris
Expand to see default predictor details
Click
Nextfor the remaining steps, then clickLaunch.
Setup Metrics Server
From the
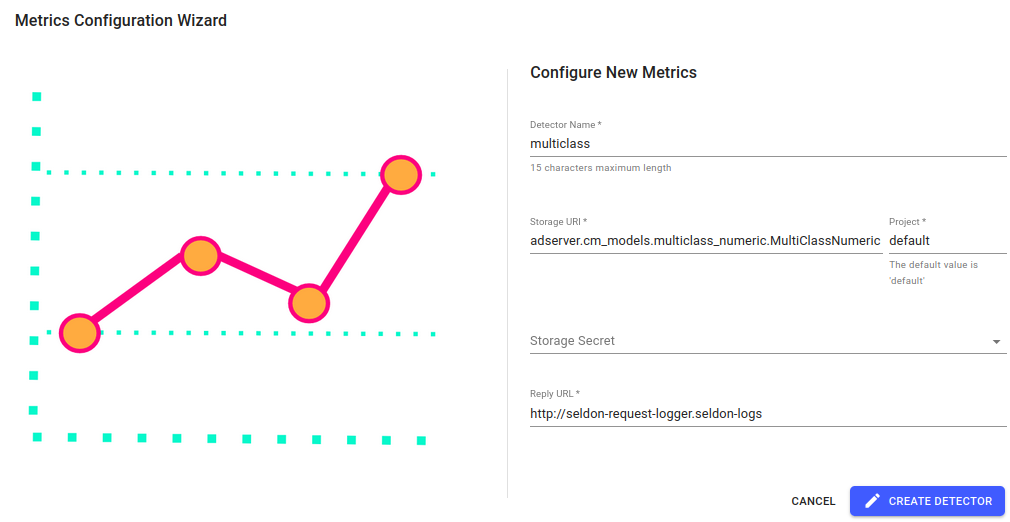
Dashboardpage, click onAddin the Metrics Server panel:Detector Name:
multiclassStorage URI:
adserver.cm_models.multiclass_numeric.MultiClassNumericStorage Secret: Leave empty as we are using a public bucket
Reply URL: Leave as default value,
http://seldon-request-logger.seldon-logs
Expand to see metrics server
Make Predictions
Run a single prediction using the ndarray payload format. Make a couple of these requests at random using the predict tool in the UI.
Go to the predict page, using the link on the left side:
Paste in the following JSON data for the prediction, and click the
Predictbutton:Inspect the response, to see that the class with the highest confidence is the second of the iris dataset,
versicolor.
Send Feedback
As we saw the prediction response was versicolor (the second class of iris).
In numeric form the response is,
{
  "data": {
    "ndarray": [
      1
    ]
  }
}
A feedback request consists of the returned value in a response (response.data on line 5) and a truth value (truth.data on line 12), for that data. For example, a true-positive feedback request looks like this:
 1{
 2  "response": {
 3    "data": {
 4      "ndarray": [
 5        1
 6      ]
 7    }
 8  },
 9  "truth": {
10    "data": {
11      "ndarray": [
12        1
13      ]
14    }
15  }
16}
We’ll send several feedback requests to the metrics server, that we set-up earlier, for various scenarios.
Set-up the environment variable(s) for the request:
(Recommended) You may also need to set-up for the
Authorizationheader:Expand to see the authorization environment variable
Return to the predict page, and paste in the prediction, as you did above
Click the
Copy as curlbutton, and copy the value that looks likeBearer <authorization header>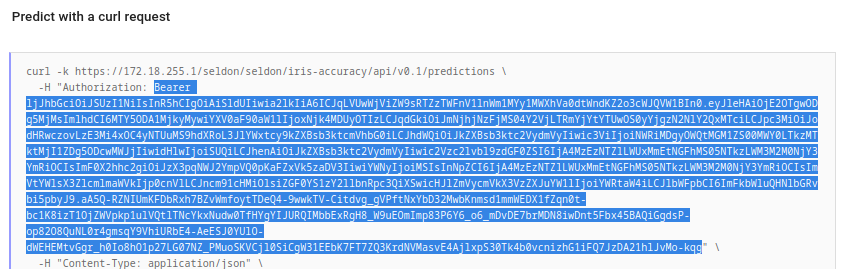
Set the environment variable:
export AUTH_TOKEN="<paste the authorization value>"
Scenario 1: True-positive:
Scenario 2: False-positive:
Monitor accuracy metrics on the Monitor Screen
Having done a prediction, metrics will begin to become available.
Go to the monitor screen’s
Prediction Accuracytab to view all the metrics.Set the time range to view the metrics, using the “From Time” and “To Time” selectors.
You can see metrics like accuracy, precision, recall and specificity here. Notice the drop in accuracy metrics after the false feedback was received.
Submit batch feedback using Batch Processor component
Now we will submit a feedback as a batch using the Batch Processor component.
We will use two files, each containing 10k feedback instances:
We need to upload the files to MinIO’s
databucket. For details on interacting with MinIO UI please see Batch Demo.Once the files are in the MinIO bucket, go to the
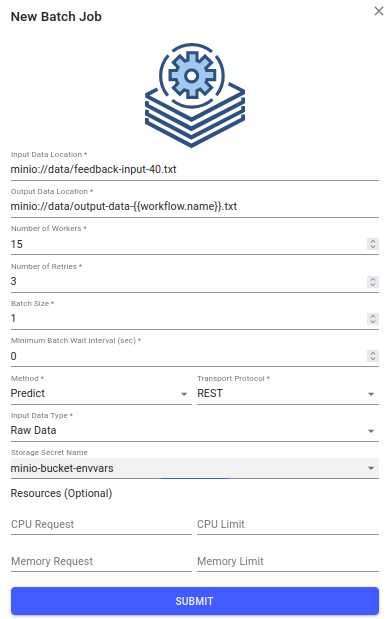
Batch Jobsscreen using either the navigation bar on the left side or with the button on the model dashboard. For each offeedback-input-90.txtandfeedback-input-40.txtfiles, submit a batch job. Wait for the first to complete before proceeding to the next. Submit batch request using the following form values:Input Data Location:
minio://data/feedback-input-40.txtOutput Data Location:
minio://data/output-data-40-{{workflow.name}}.txtNumber of Workers:
15Number of Retries:
3Batch Size:
1Minimum Batch Wait Interval (sec):
0Method:
FeedbackTransport Protocol:
RESTInput Data Type:
Raw DataObject Store Secret Name:
minio-bucket-envvarsResources:
Leave defaults
Expand to see batch job
Now go to the monitor view and observe how metrics value evolve over time.
Troubleshooting
If you experience issues with this demo, see the troubleshooting docs and also the Knative or Elasticsearch sections.