 Seldon Enterprise Platform Documentation Update
Model Explanations with Tabular Data
In this demo we will:
Launch an income classification model which has tabular training features
Send a request to get a prediction
Create an explainer for the model
Send the same request and then get an explanation for it
This demo uses a model trained to predict high or low income based on demographic features from a 1996 US census.
The explanation will offer insight into why an input was classified as high or low. It uses the anchors technique to track features from training data that correlate to category outcomes.
Create Model
Click on
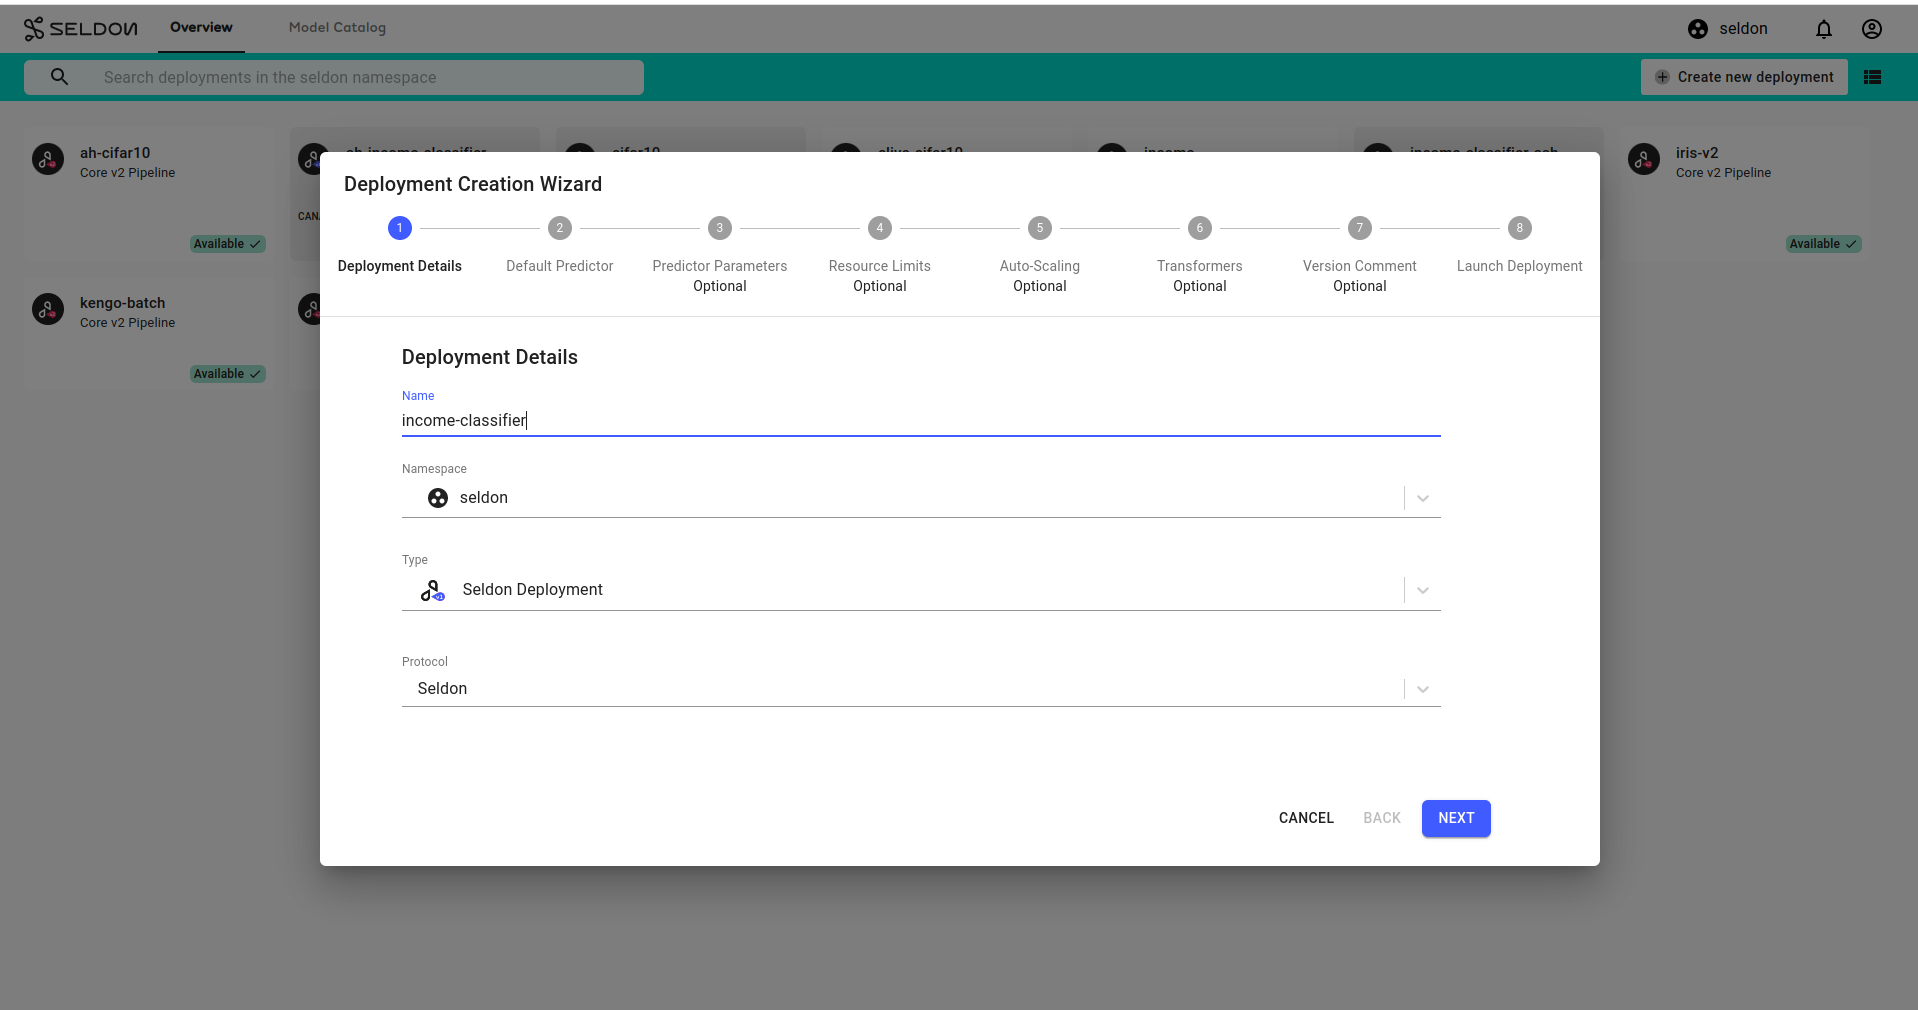
Create new deploymentbutton.Enter the deployment details as follows:
Name: income-classifier
Namespace: seldon
Type: Seldon Deployment
Protocol: Seldon
Expand to see deployment
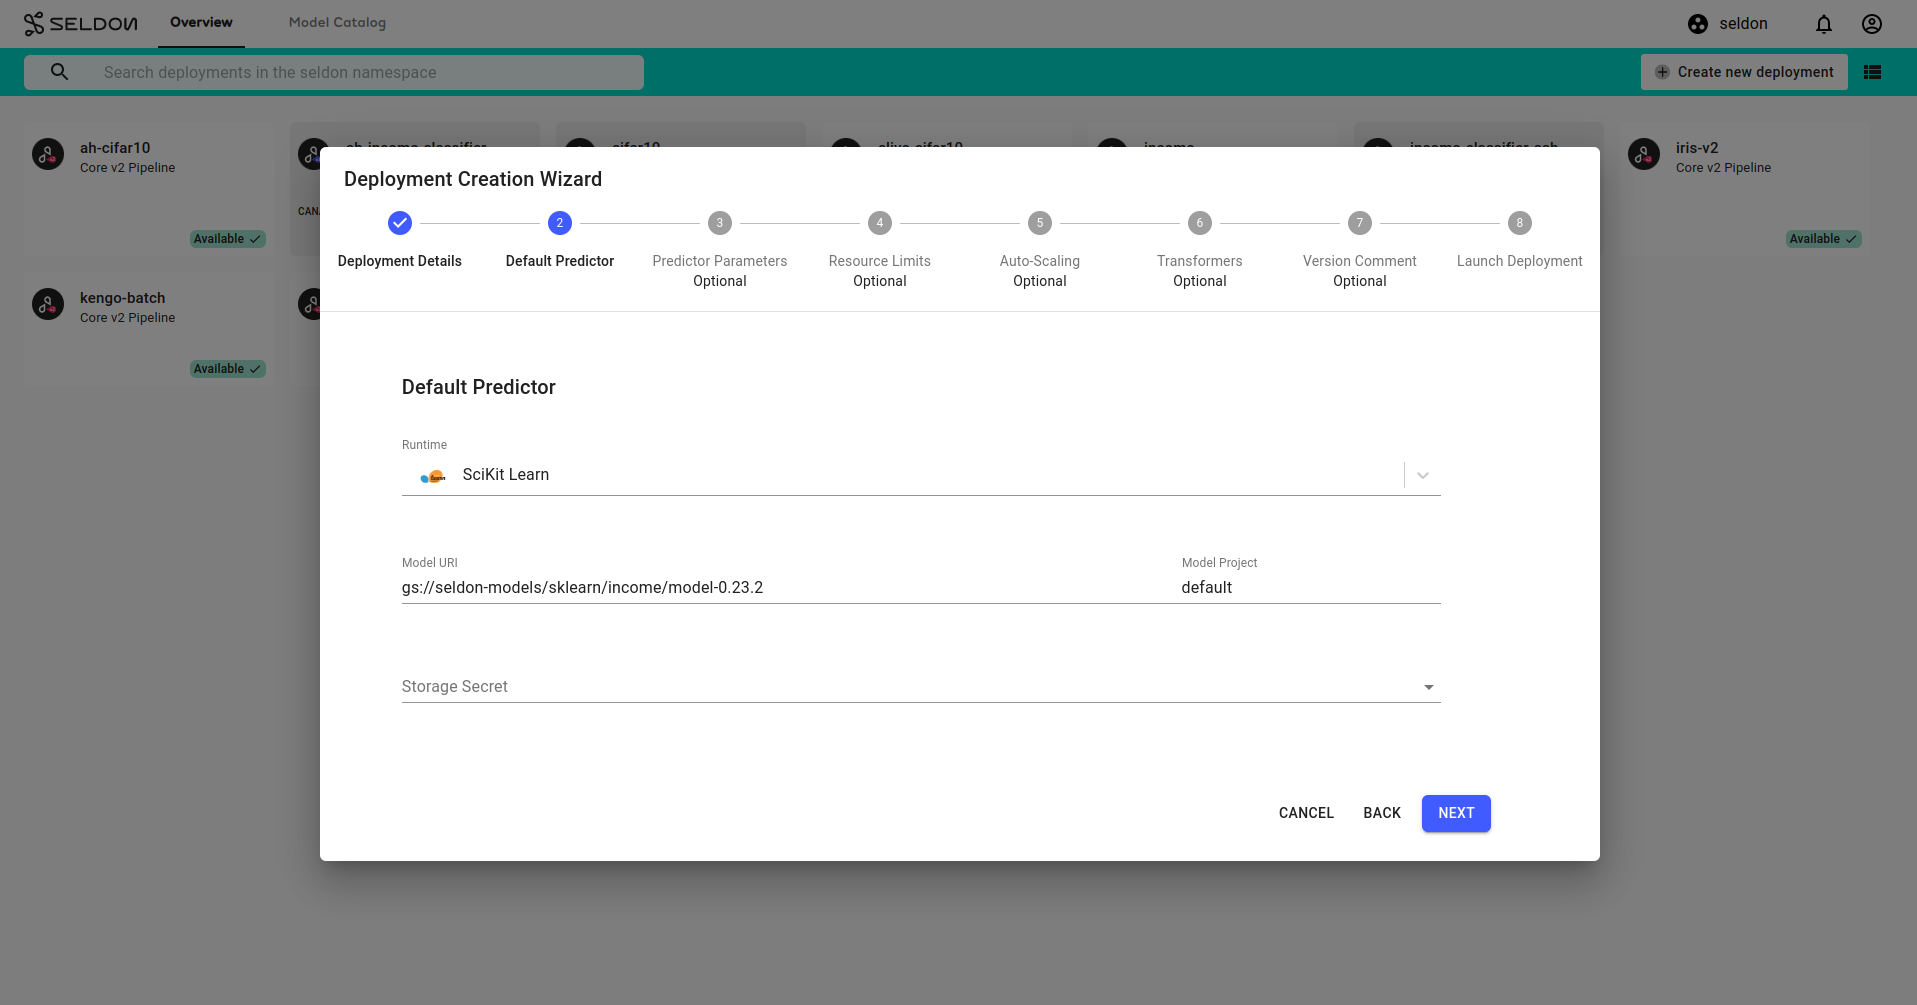
Configure the default predictor as follows:
Runtime: Scikit Learn
Model URI:
gs://seldon-models/sklearn/income/model-0.23.2Model Project: default
Storage Secret: (leave blank/none)
Expand to see default predictor
Skip
Nextfor the remaining steps, then clickLaunch.If your deployment is launched successfully, it will have
Availablestatus, on the overview page.
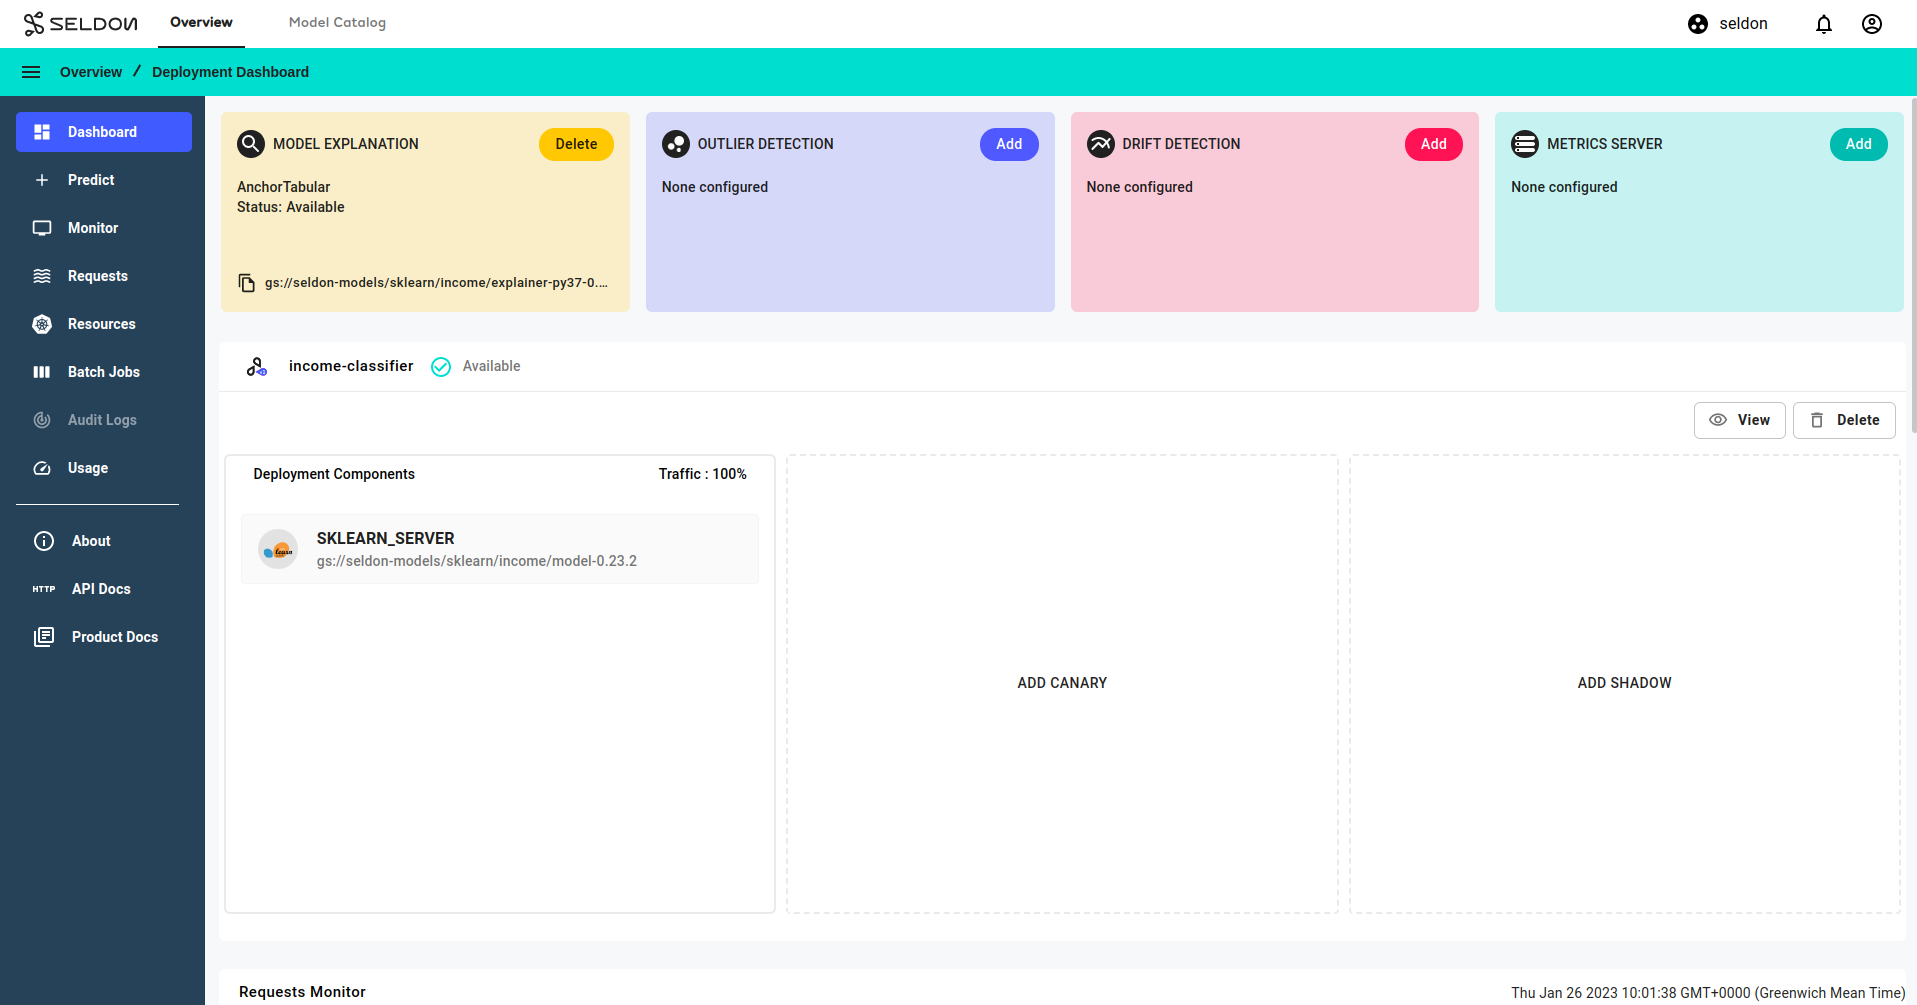
Get Predictions
Click on the
income-classifierdeployment created in the previous section to enter the deployment dashboard.Inside the deployment dashboard, on the left navigation drawer, click on the
Predictbutton.On the
Predictpage, enter the following text:
{
  "data": {
    "names": [
      "Age",
      "Workclass",
      "Education",
      "Marital Status",
      "Occupation",
      "Relationship",
      "Race",
      "Sex",
      "Capital Gain",
      "Capital Loss",
      "Hours per week",
      "Country"
    ],
    "ndarray": [
      [
        53,
        4,
        0,
        2,
        8,
        4,
        2,
        0,
        0,
        0,
        60,
        9
      ]
    ]
  }
}
Click the
Predictbutton.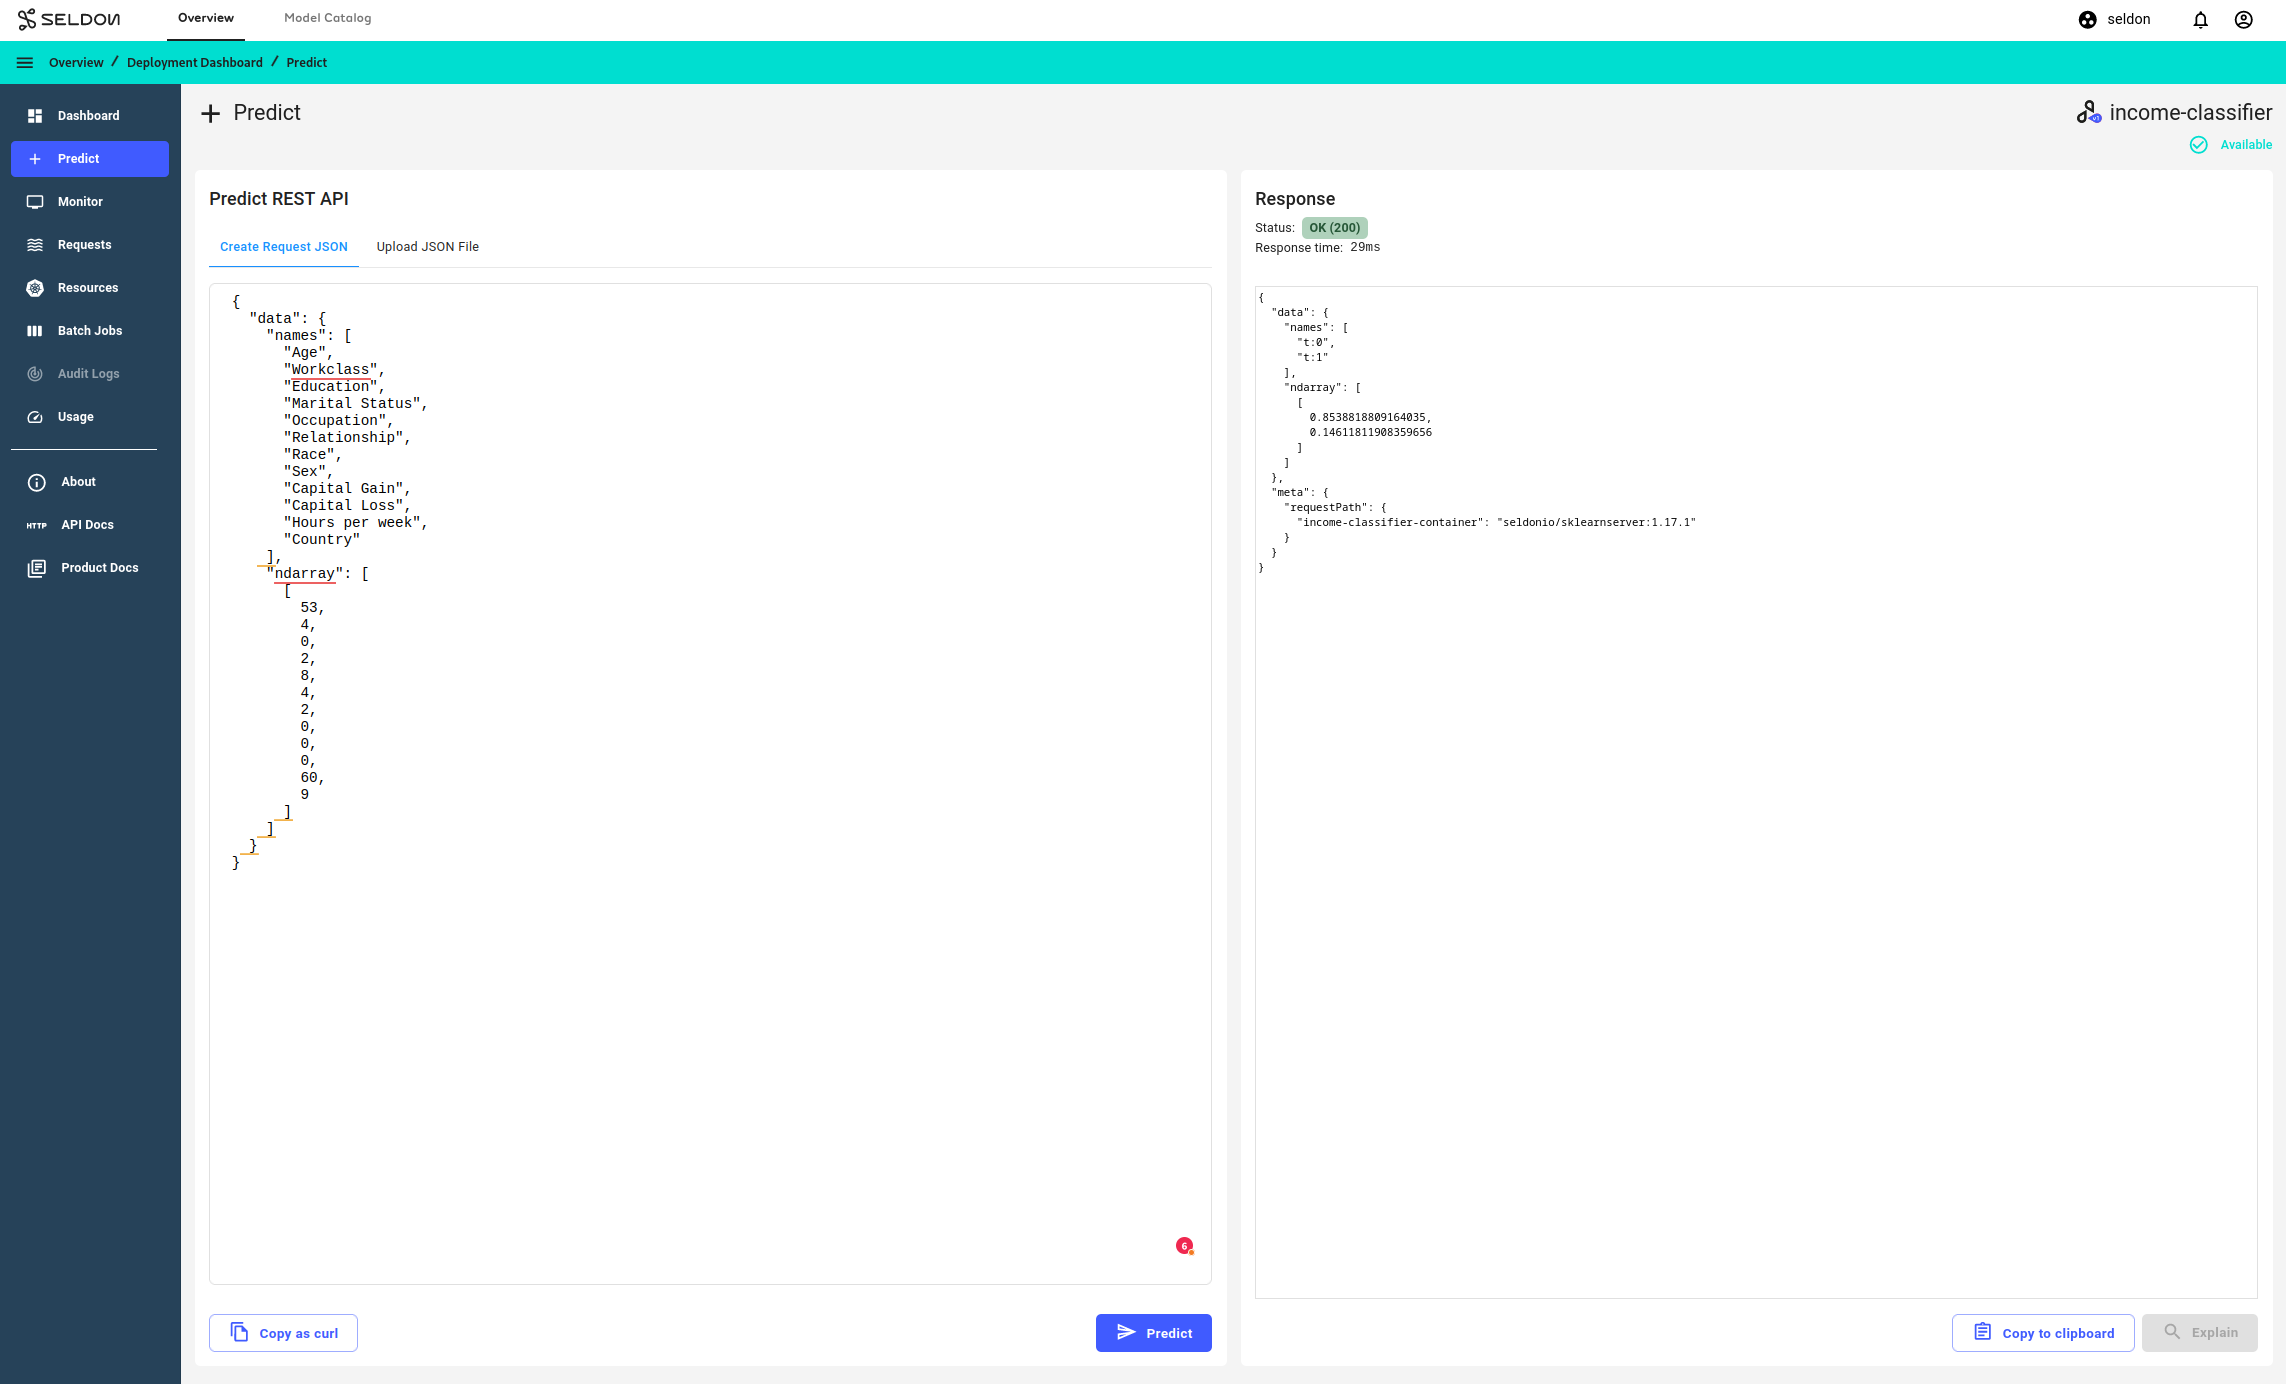
Add a Tabular Explainer
There are currently 2 explainers available for tabular data classification:
Anchor Explainer
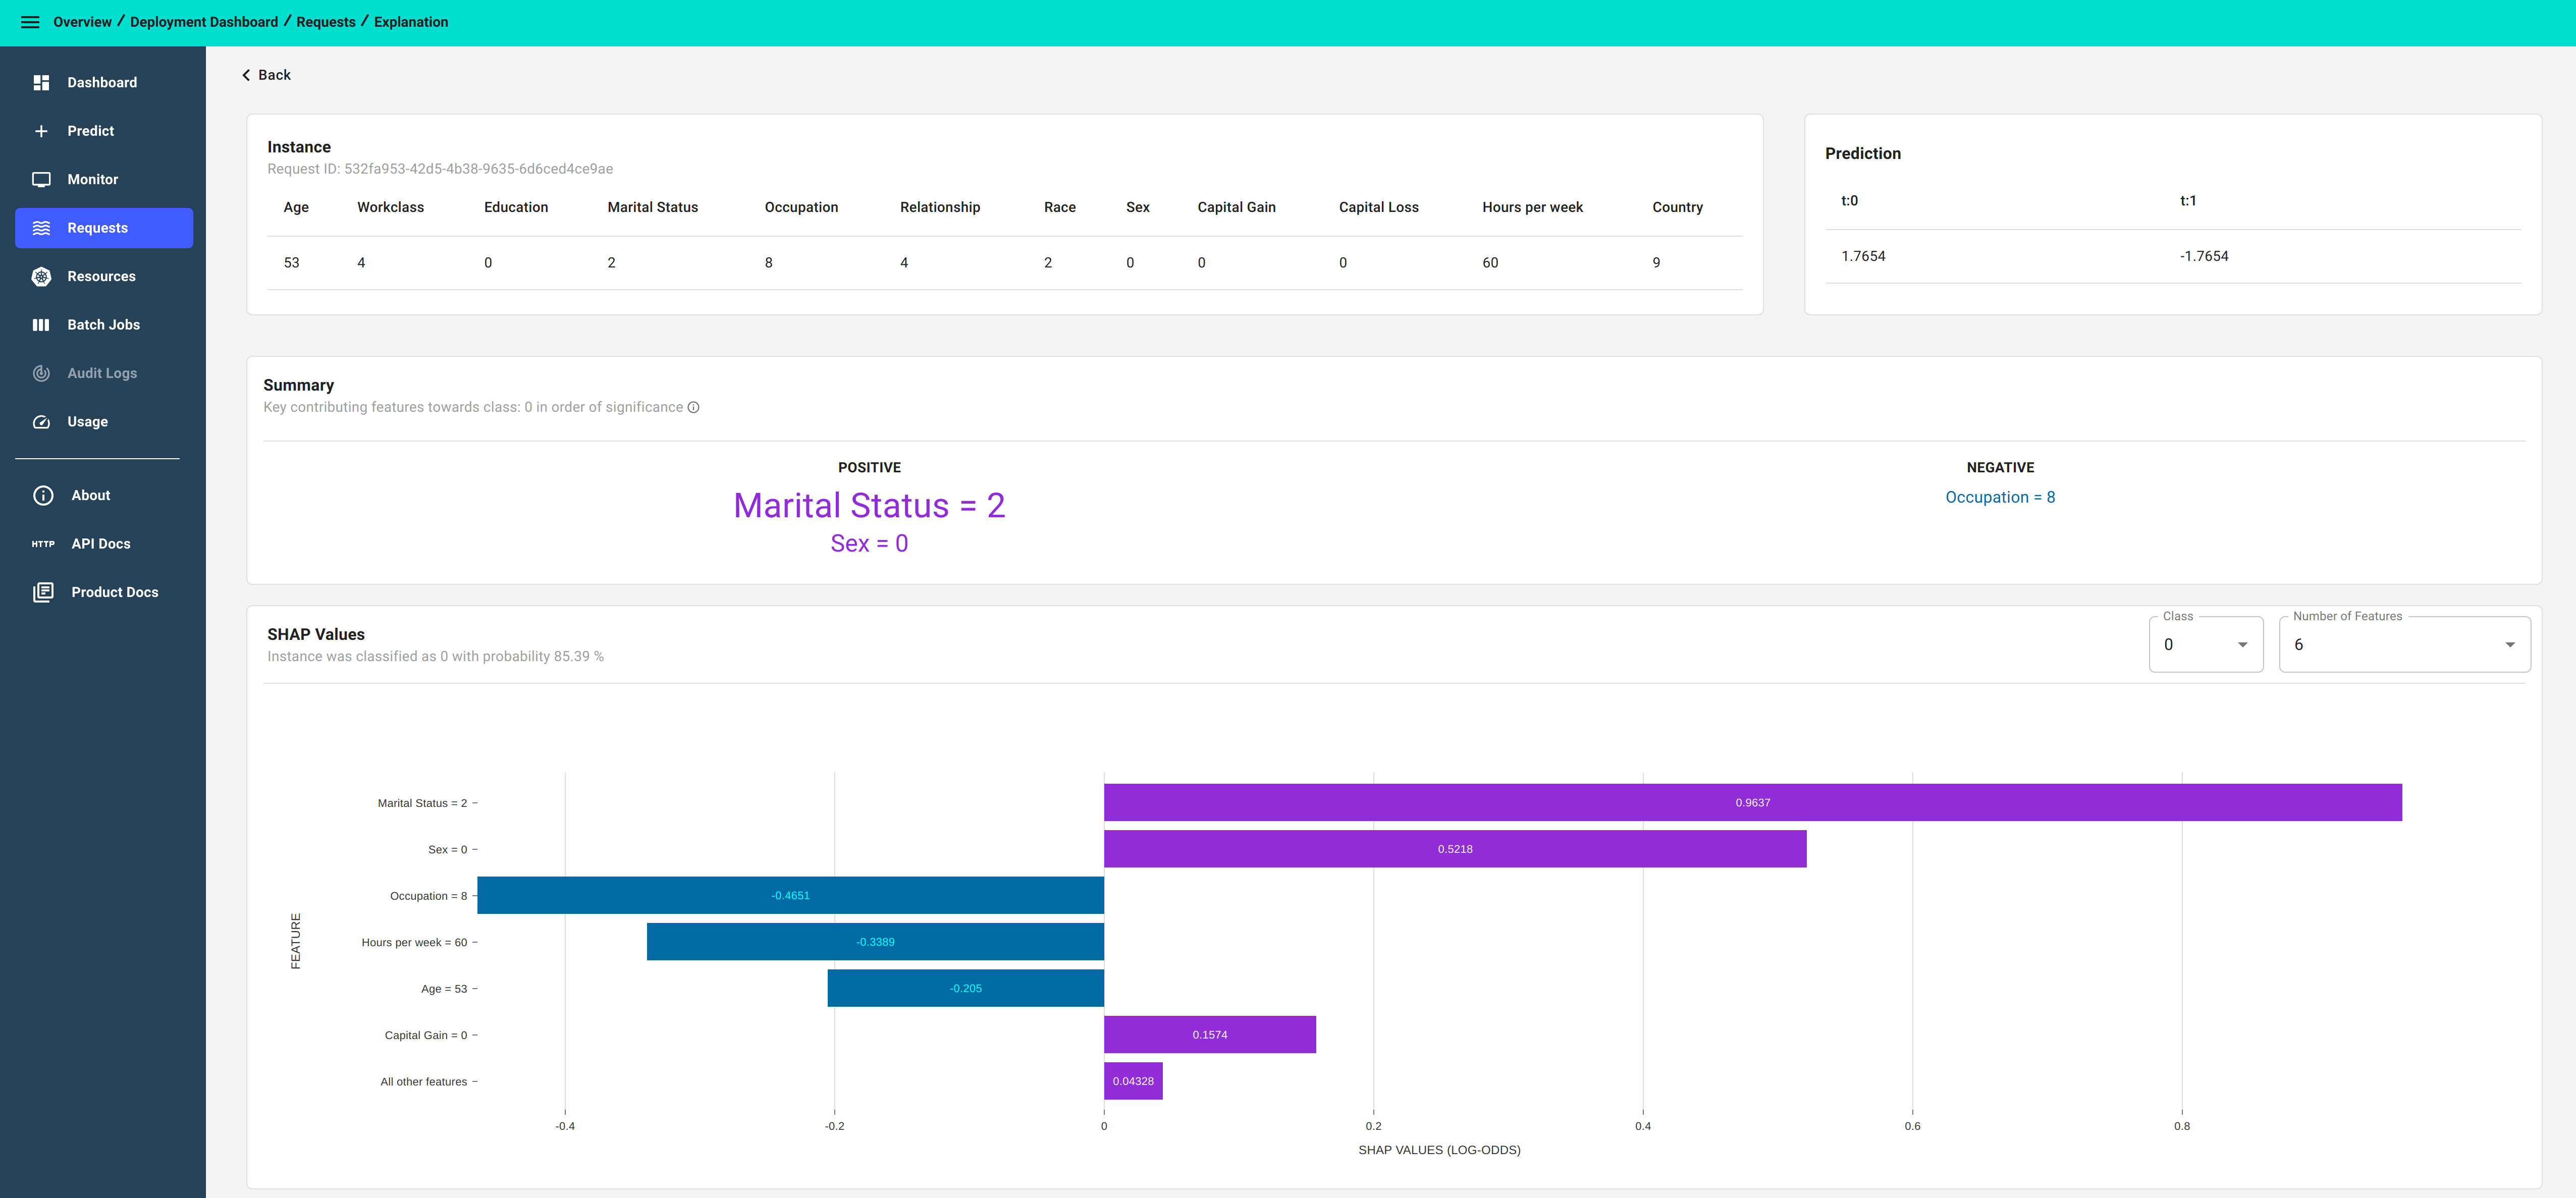
Kernel SHAP Explainer
From the
income-classifierdeployment dashboard, clickAddinside theModel Explanationcard.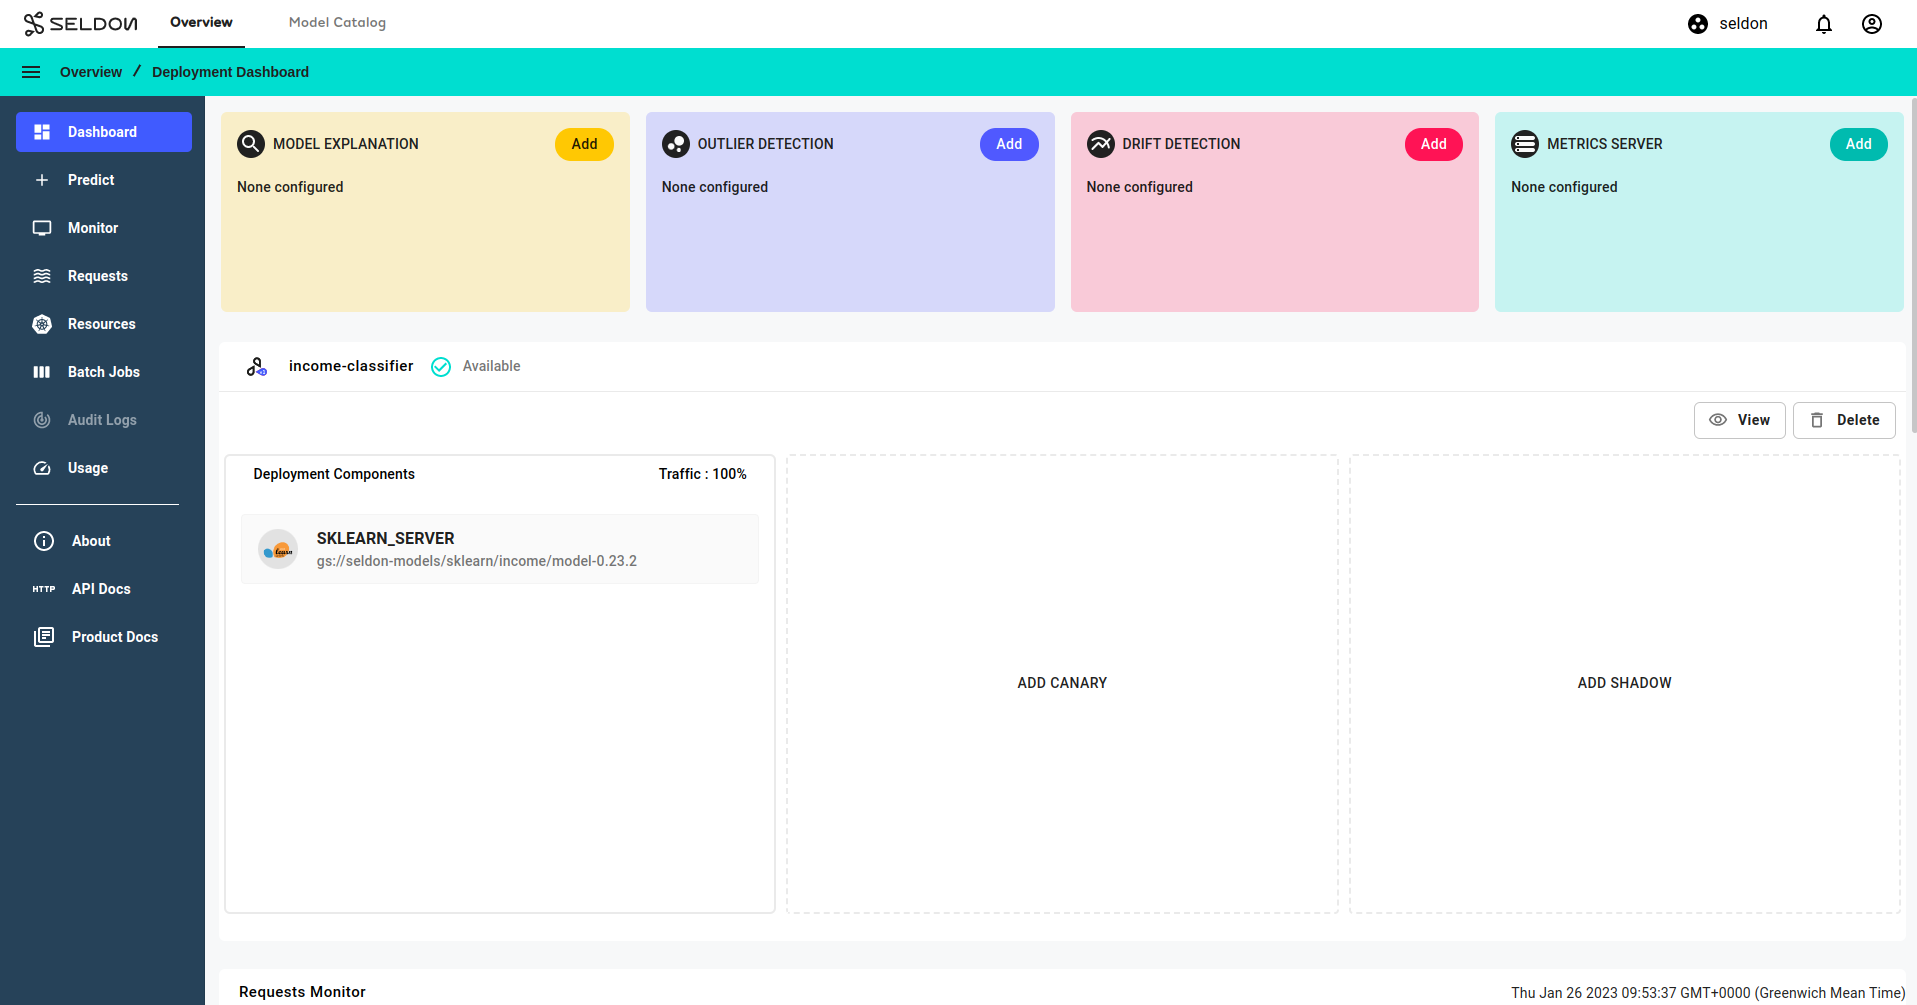
For step 1 of the Explainer Configuration Wizard, select
Tabularthen clickNext.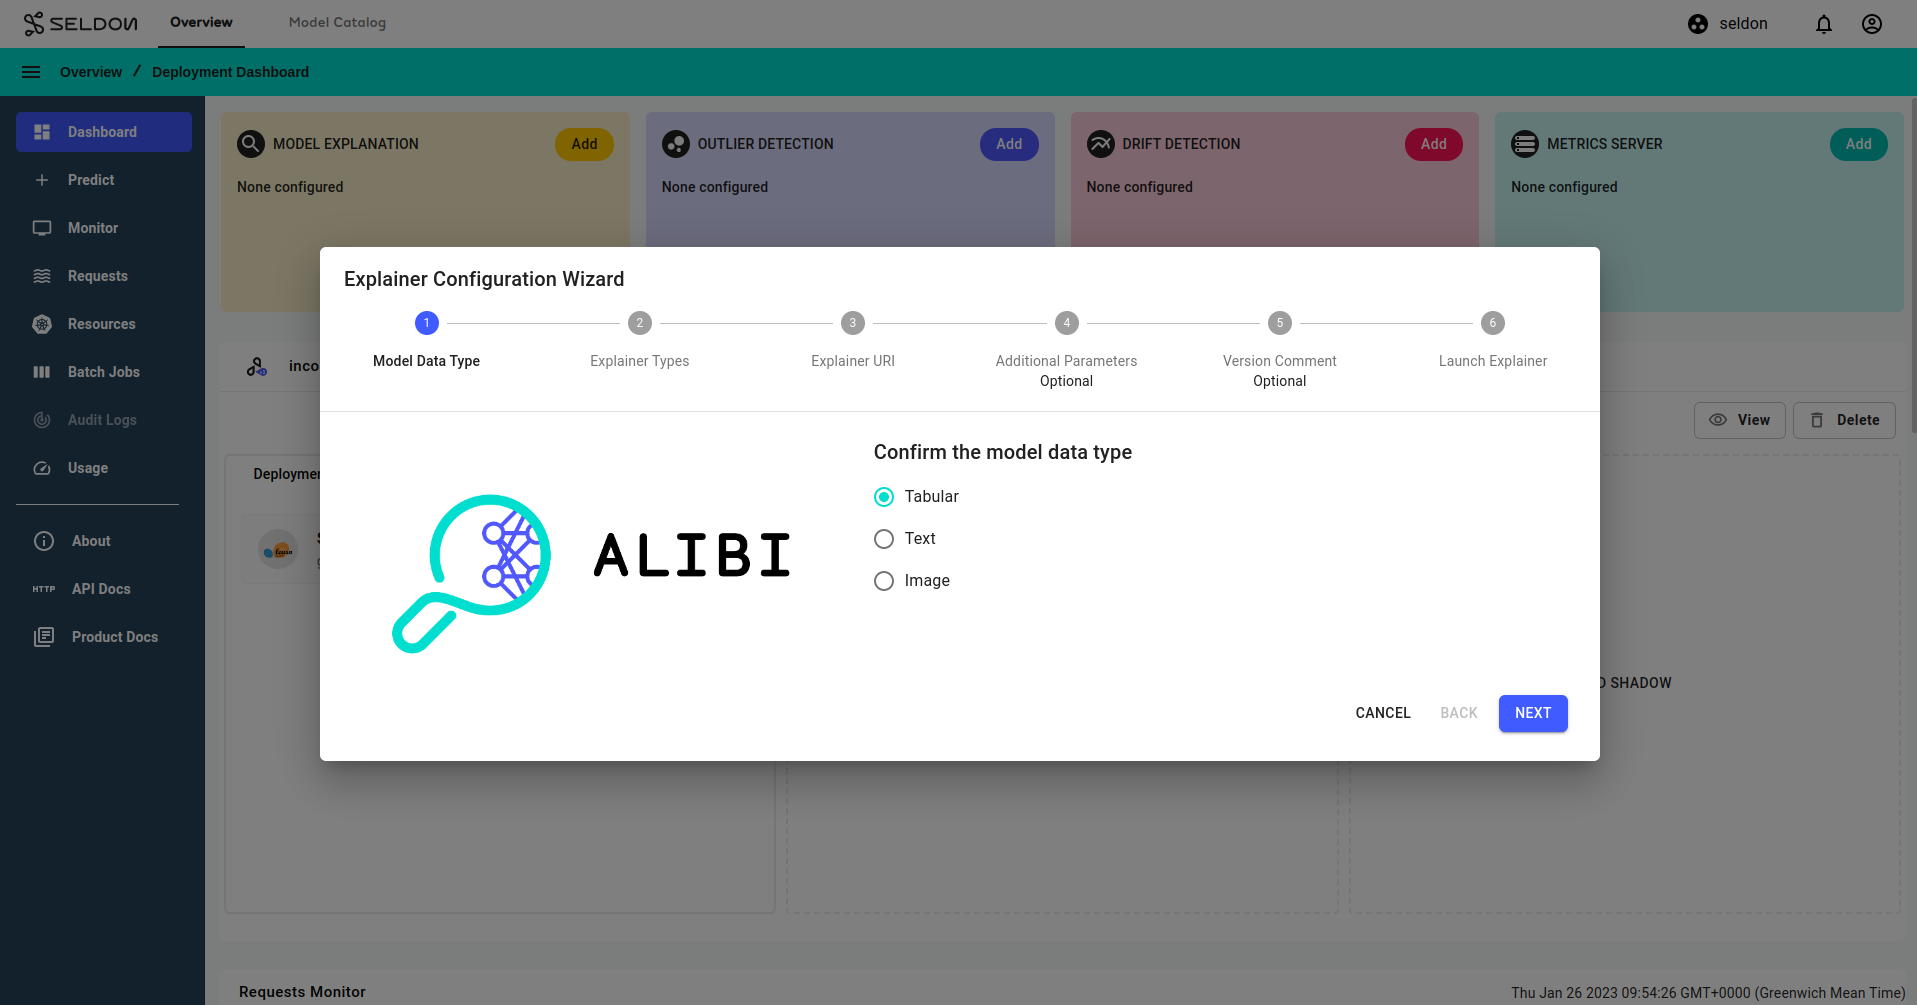
For step 2, click the
Anchorradio button, then clickNext.For step 3, enter the following value for the
Explainer URI:gs://seldon-models/sklearn/income/explainer-py38-0.9.4
then click
NextFor step 2, click the
KernelShapradio button, then clickNext.For step 3, enter the following value for the
Explainer URI:gs://seldon-models/alibi/income-kernelshap-explainer-python3.8-alibi-0.7.1dev
then click
NextFor step 4, click
Next. (Do not change any fields).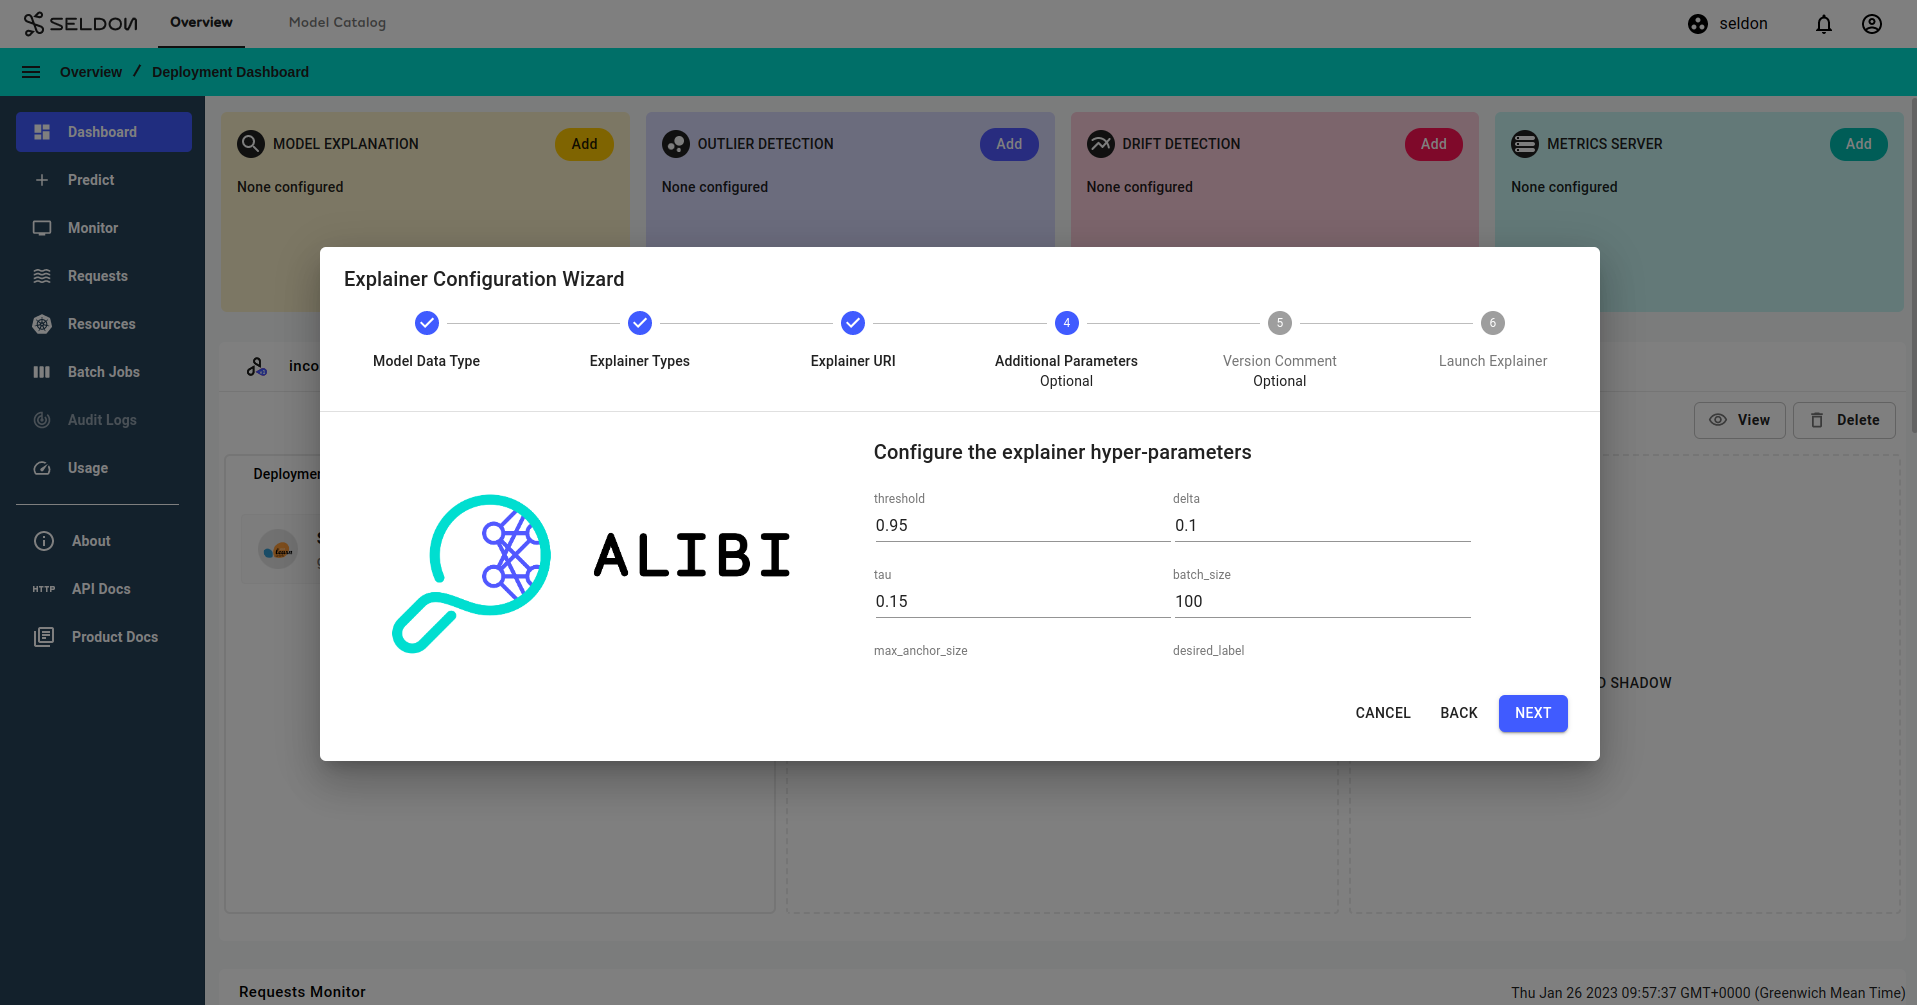
For step 5, click
Next. (Do not change any fields). You may wish to enter a comment here for a gitops enabled namespace.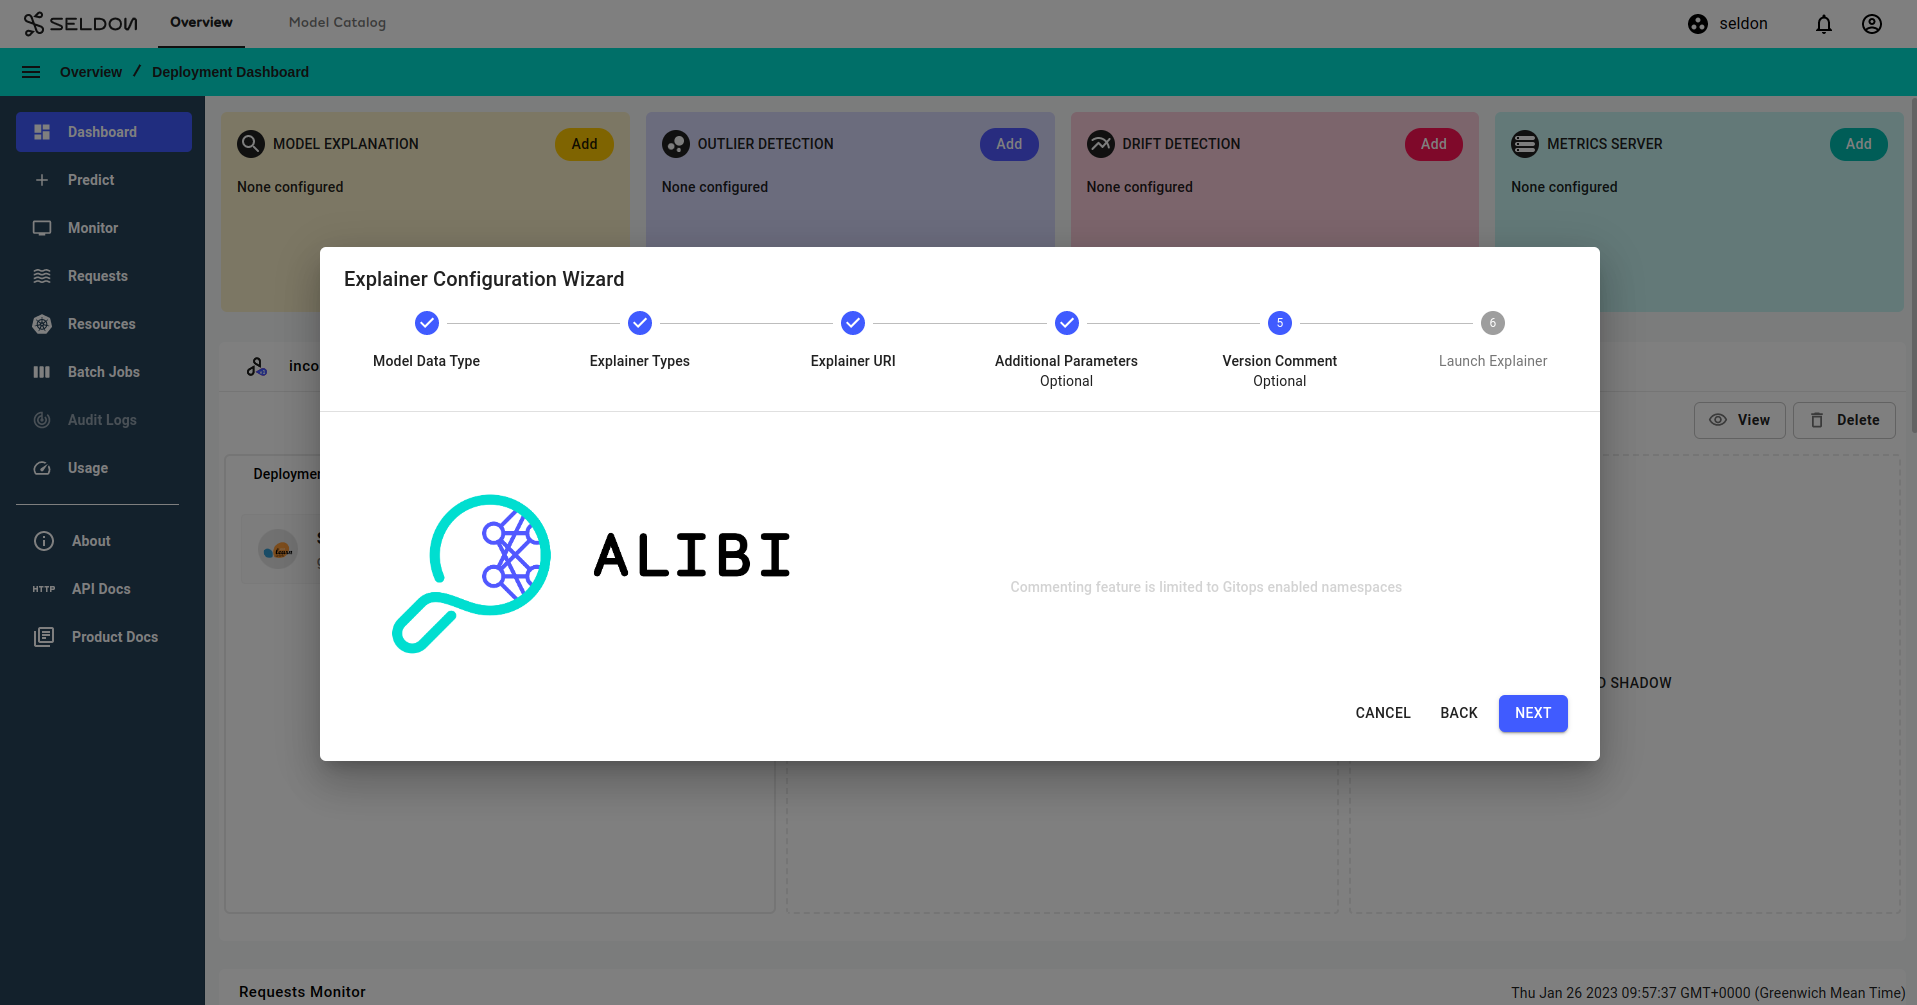
For step 6, click
Launch.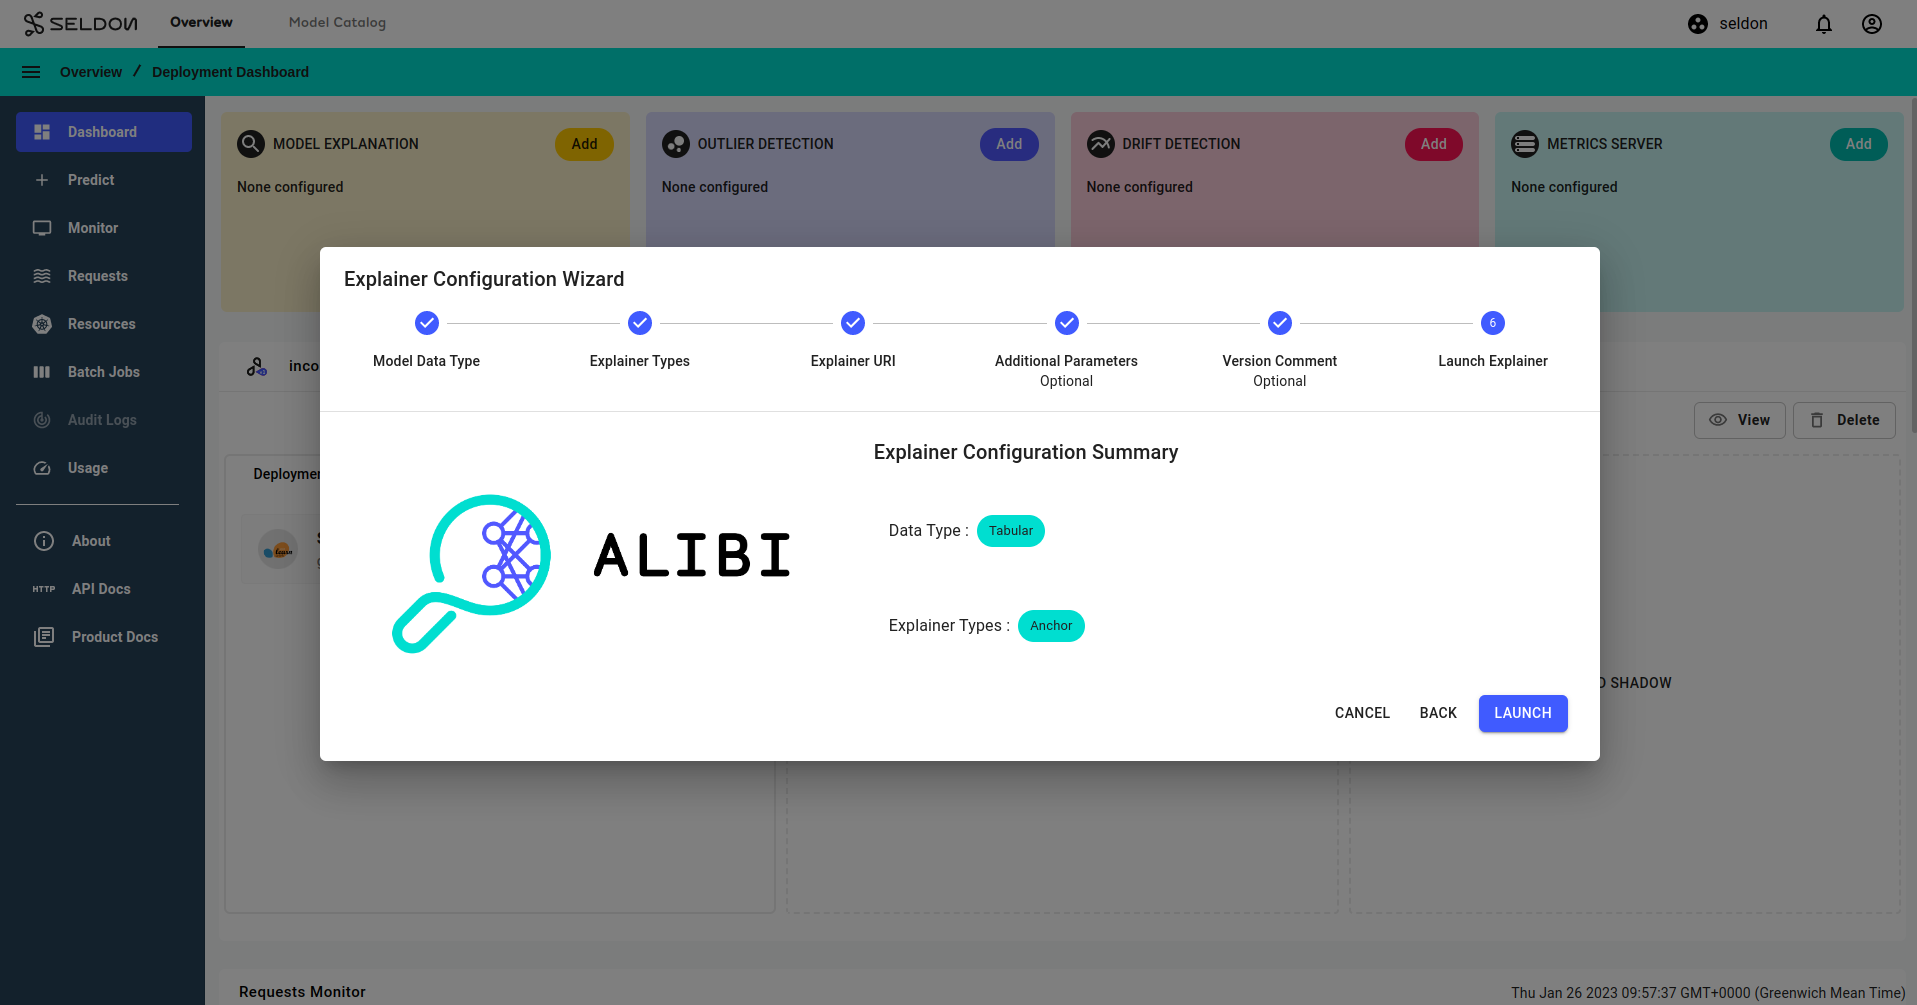
After a short while, the explainer should become available.
Get Explanation for one Request
Navigate to the
Requestspage using the left navigation drawer.Click on the
View explanationbutton to generate explanations for the request.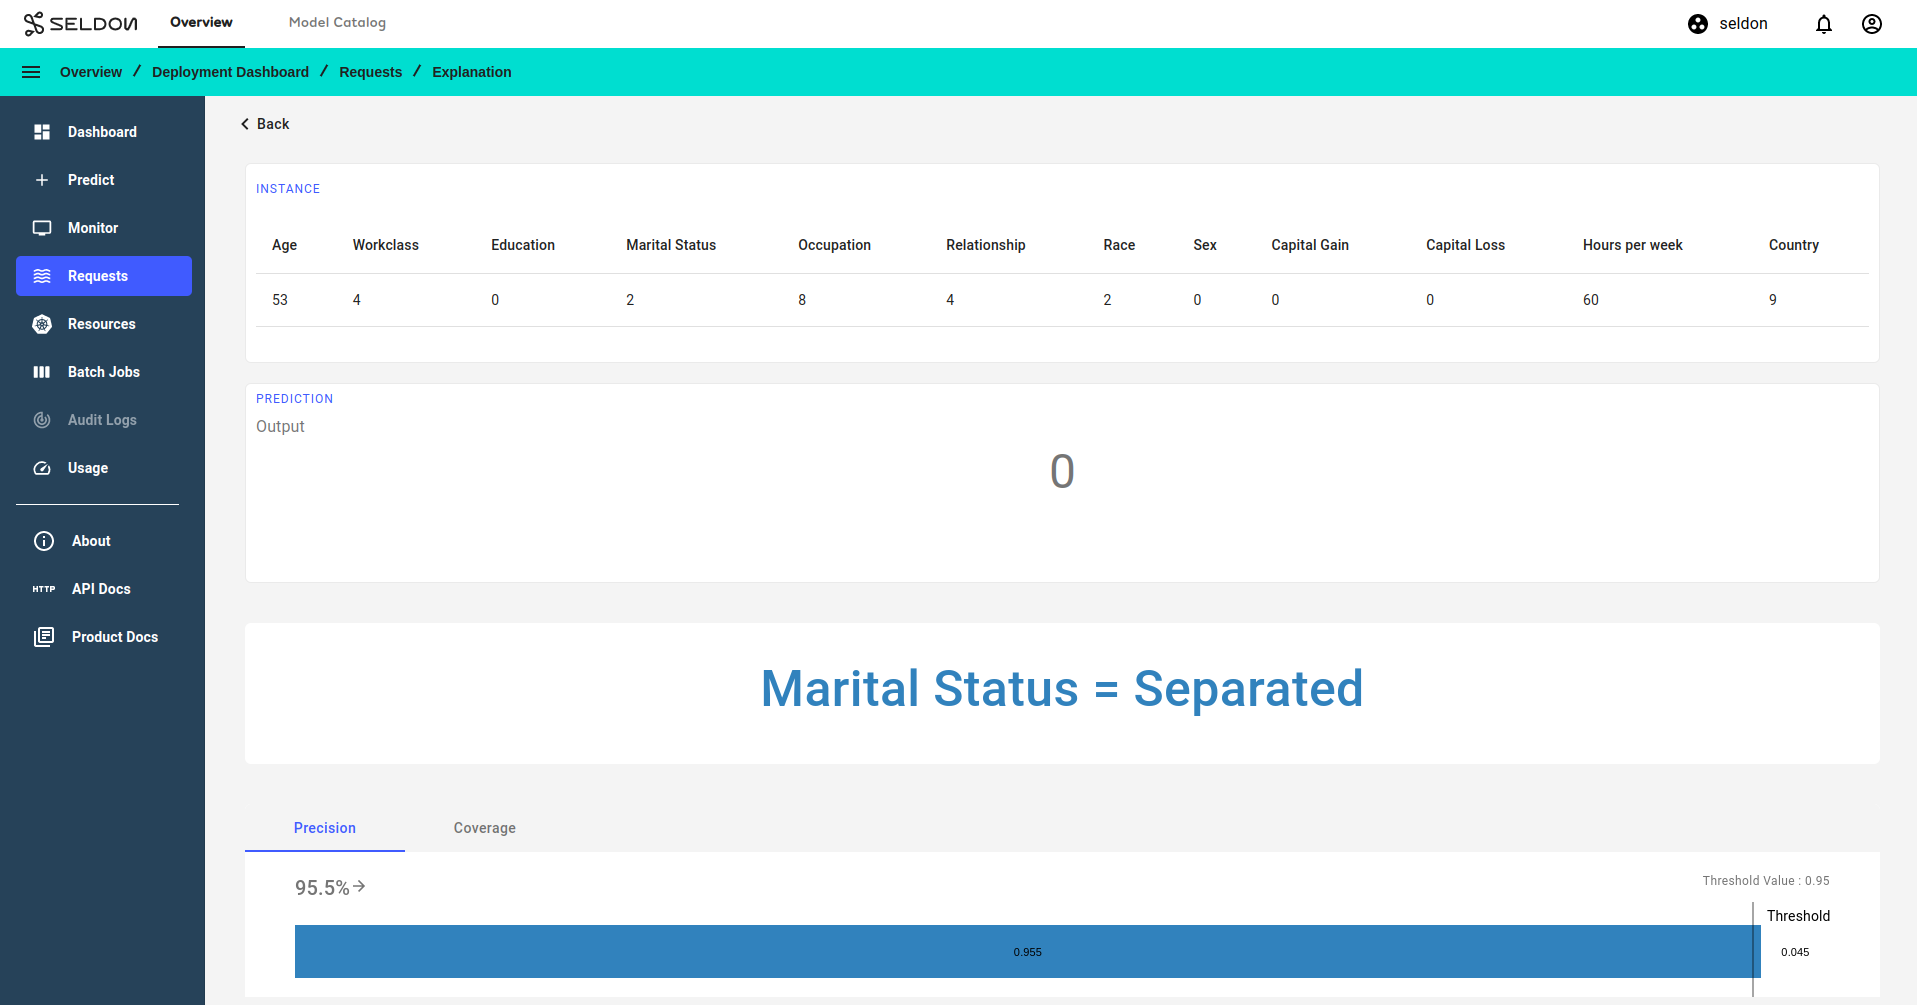
Congratulations, you’ve created an explanation for the request! 🥳
The anchors reveal which features most contributed to the classification of ‘Low Income’. Here, for nearly 98% of the training data a Marital Status of ‘Separated’ correlates to Low Income. Having no Capital Gain also correlates but is a less strong indicator.
At the bottom we are shown other examples of Low Income data points. This helps to reveal the patterns that the model is relying on to make predictions.
Next Steps
Why not try our other demos? Ready to dive in? Read our operations guide to learn more about how to use Enterprise Platform.